Fig. 14.
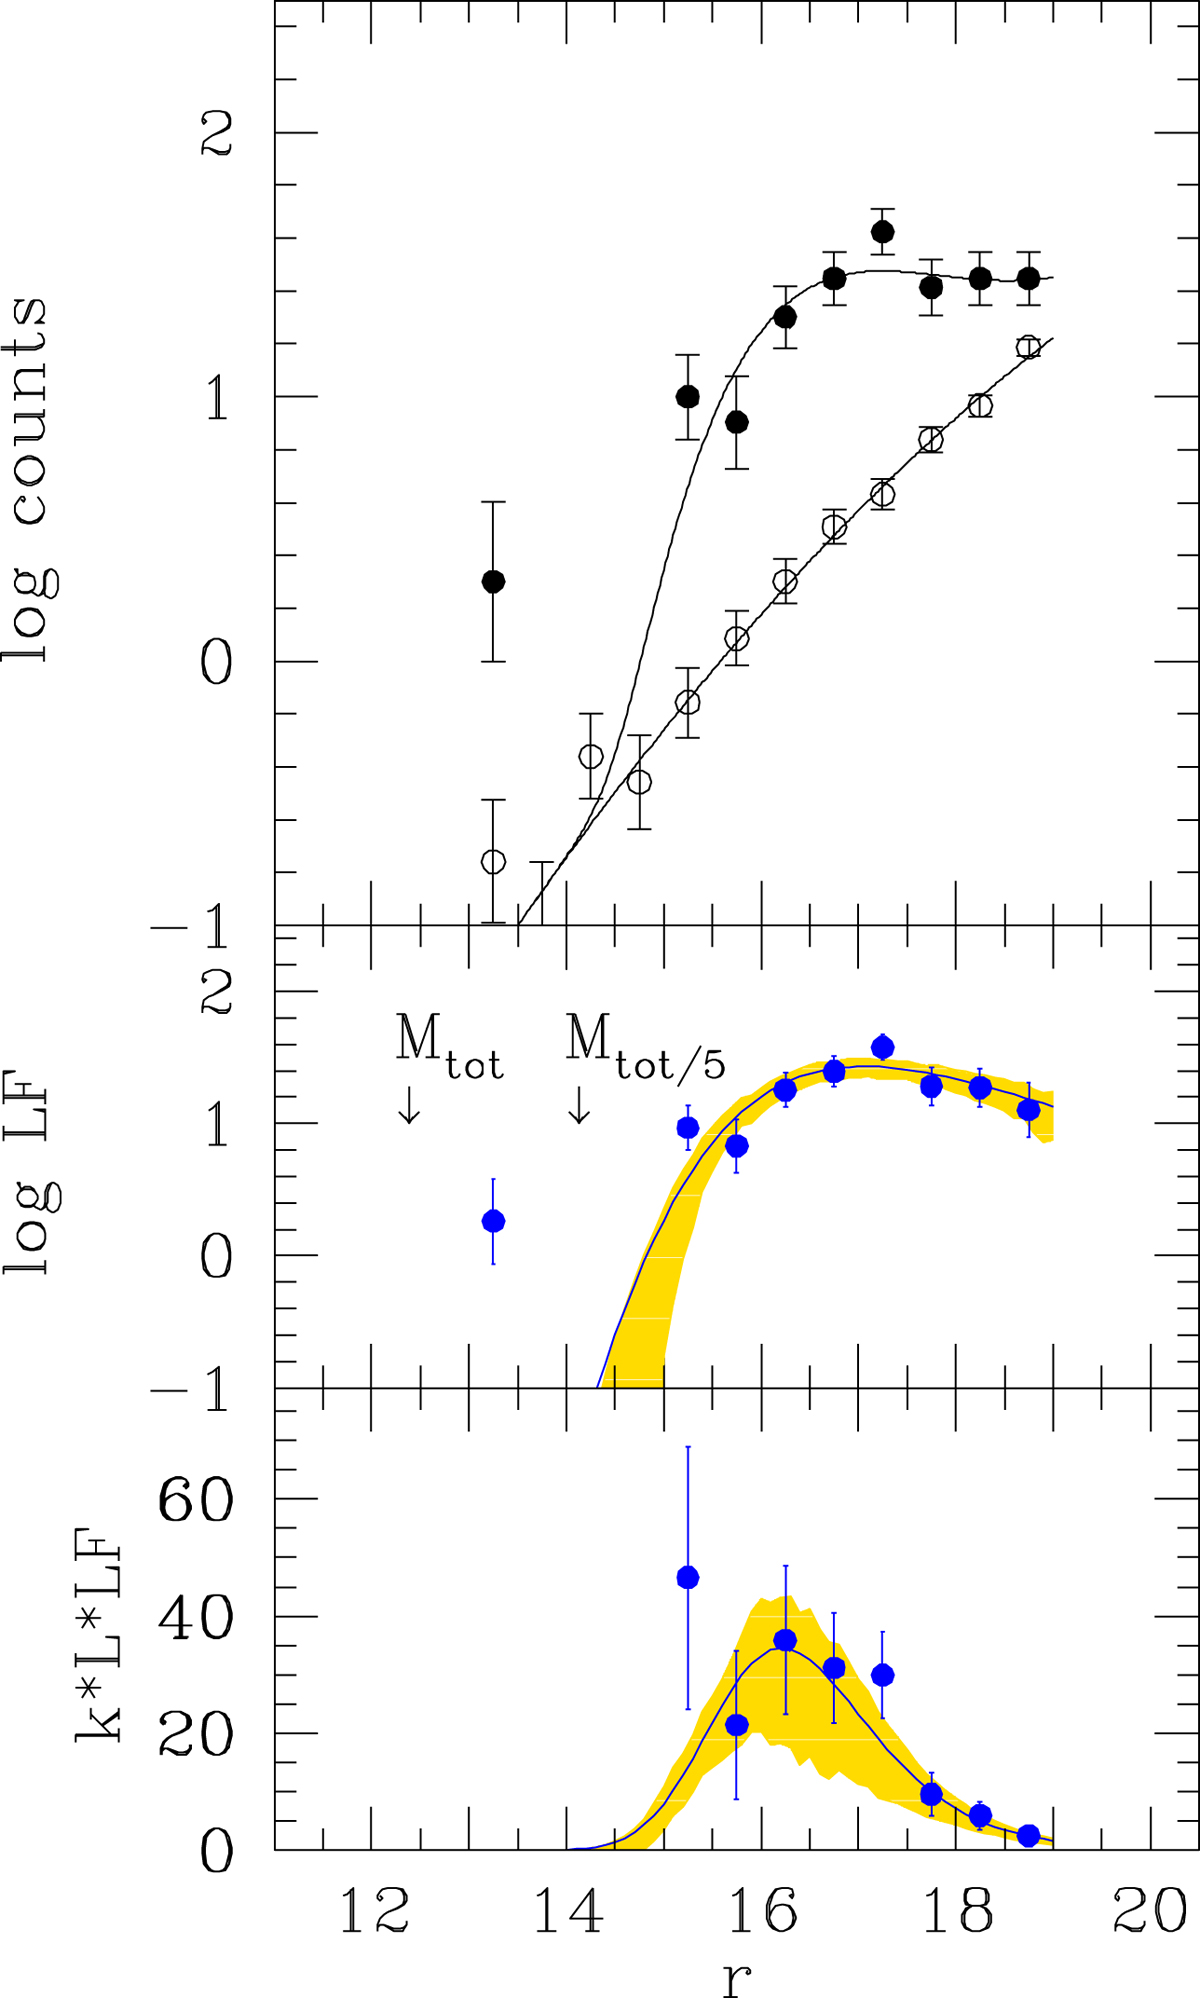
Luminosity Function determination. Upper panel: galaxy log counts in the CL2015 direction (solid dots), in an adjacent line of sight for background estimation (open dots). The cluster contribution is given by the difference of the two counts, shown in the middle panel, which also reports the integral of the luminosity function (Mtot) and 1/5th of it (Mtot/5). The bottom panel gives the luminosity contribution of each magnitude bin (in arbitrary units). Curves mark the fitted model to un-binned data, after removal of the brightest cluster galaxy. Approximated point errors (computed with the usual sum in quadrature) are marked with bars; precisely computed 68% errors on the model are shaded.
Current usage metrics show cumulative count of Article Views (full-text article views including HTML views, PDF and ePub downloads, according to the available data) and Abstracts Views on Vision4Press platform.
Data correspond to usage on the plateform after 2015. The current usage metrics is available 48-96 hours after online publication and is updated daily on week days.
Initial download of the metrics may take a while.