Fig. 1.
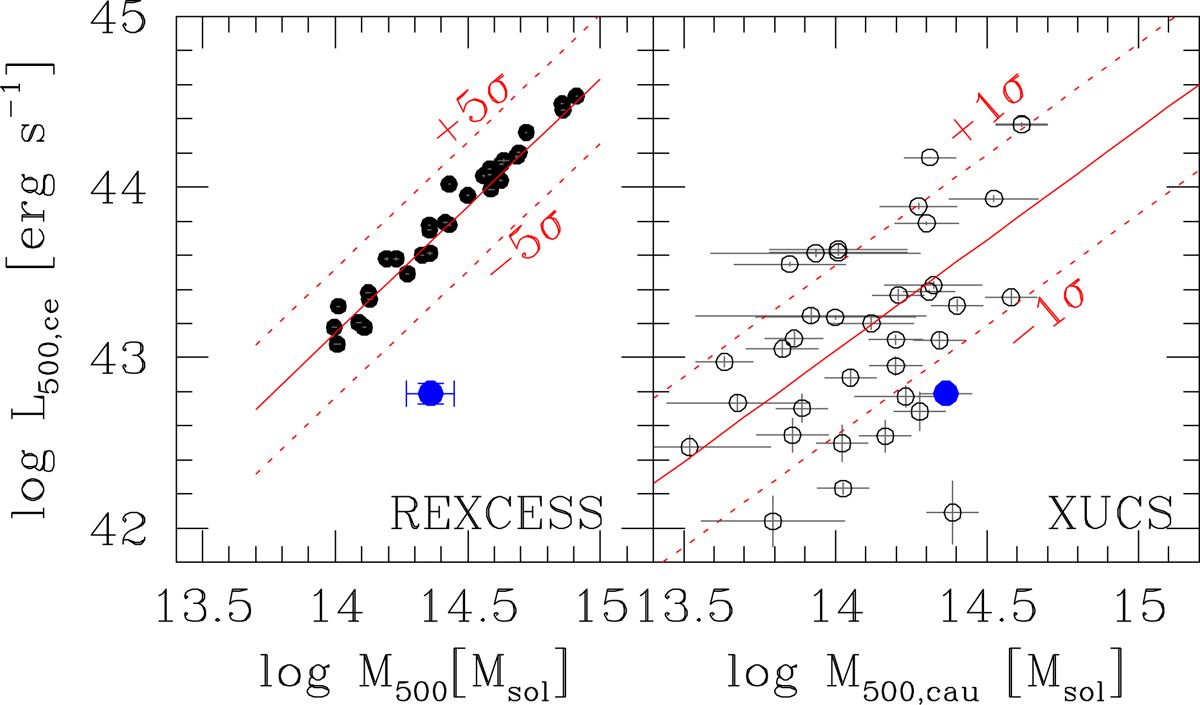
Core-excised [0.5–2] keV band X-ray luminosity vs. mass M500. Left panel: black points are REXCESS (X-ray selected) clusters and use YX-based masses. The red line is the Malmquist- and selection-bias-corrected fit to the REXCESS X-ray selected sample, whereas the dashed lines mark the mean relation ±5σintr. The blue outlying point is CL2015. Right panel: open circles are XUCS clusters, the blue point is CL2015. The red line and the ±1σ corridor is a fit to this sample (Andreon et al. 2017).
Current usage metrics show cumulative count of Article Views (full-text article views including HTML views, PDF and ePub downloads, according to the available data) and Abstracts Views on Vision4Press platform.
Data correspond to usage on the plateform after 2015. The current usage metrics is available 48-96 hours after online publication and is updated daily on week days.
Initial download of the metrics may take a while.