Fig. 9
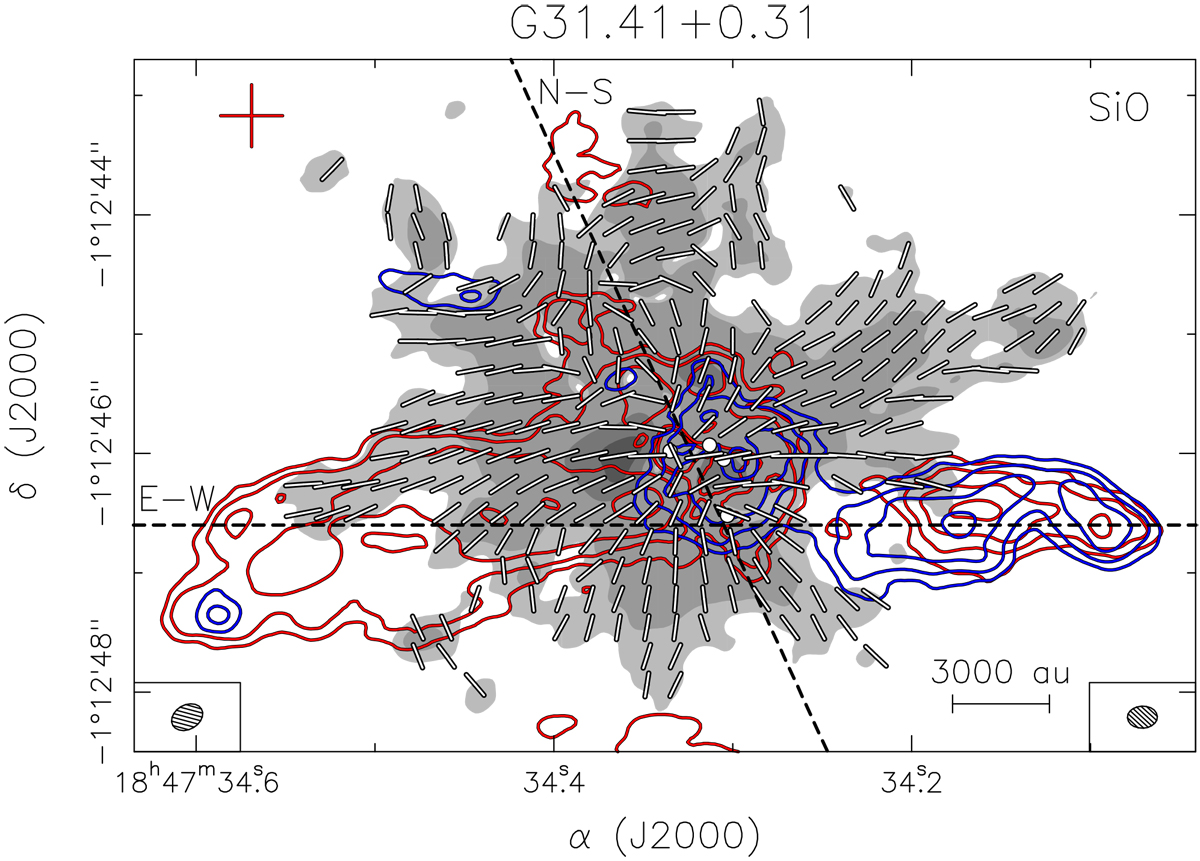
Overlay of the blue-shifted (blue contours) and red-shifted (red contours) SiO (5–4) averaged emission from BEL18 on the polarized intensity map (gray scale). The blue-shifted and red-shifted emission have been averaged over the (73, 90) km s−1 and (103, 119) km s−1 velocity interval, respectively. Contour levels are 3, 6, 12, and 24 times 1.1 mJy beam−1. Gray-scale contours for the polarized intensity are 5, 10, 50, and 90 times σ, where 1σ is 22 μJy beam−1. The white segments, plotted every ten pixels, indicate the magnetic field lines. White dots mark the position of the four embedded continuum sources (Beltrán et al., in prep.). Dashed black lines indicate the direction of the E–W and N–S outflows mapped in SiO by BEL18. The synthesized beam of the polarized emission and of the SiO observations are shown in the lower left-hand and lower right-hand corner, respectively.
Current usage metrics show cumulative count of Article Views (full-text article views including HTML views, PDF and ePub downloads, according to the available data) and Abstracts Views on Vision4Press platform.
Data correspond to usage on the plateform after 2015. The current usage metrics is available 48-96 hours after online publication and is updated daily on week days.
Initial download of the metrics may take a while.