Fig. 7
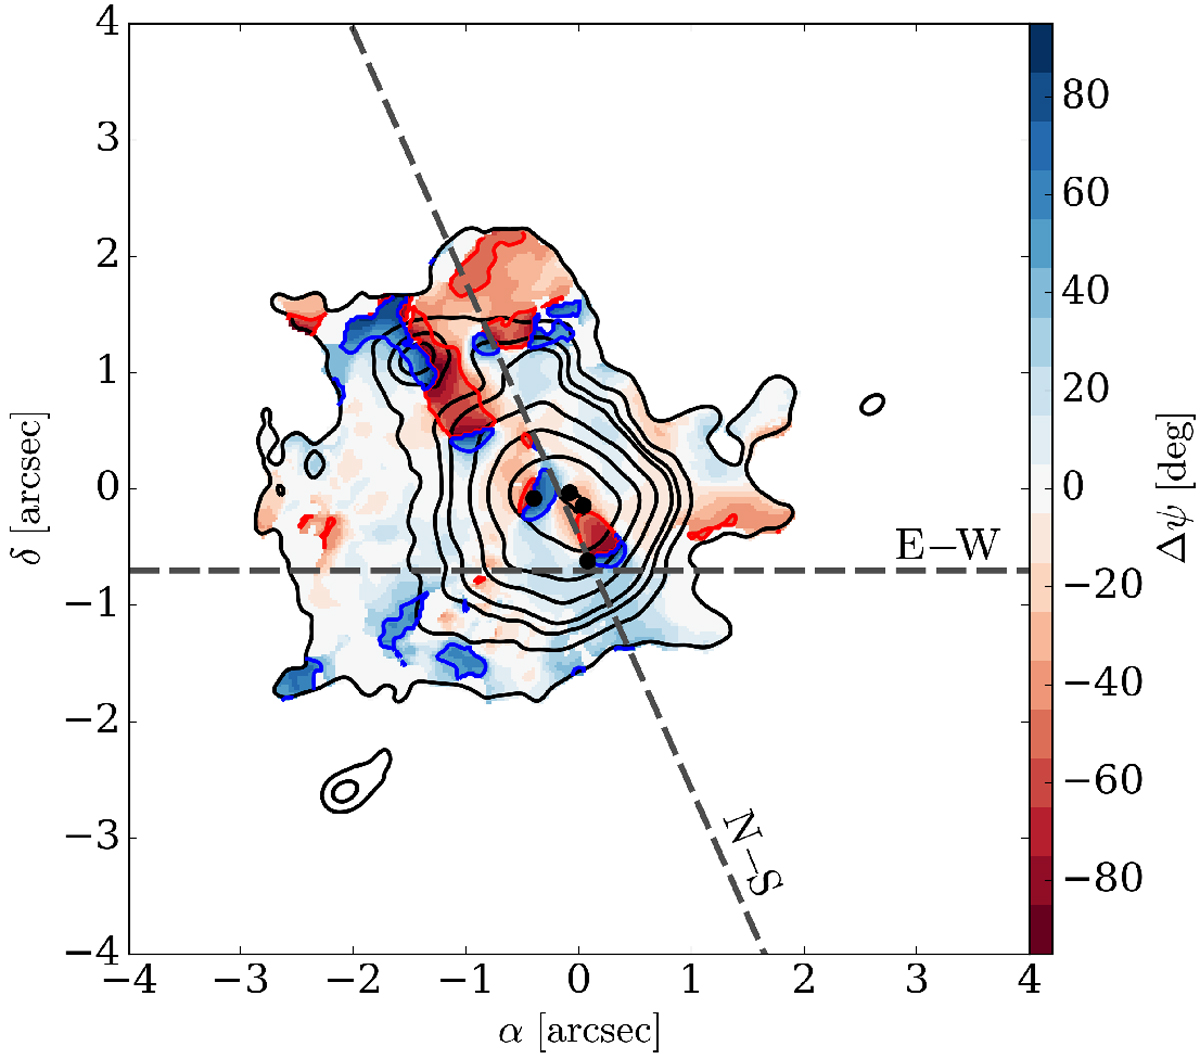
Polarization angle residuals (color map) superposed the 1.3 mm dust continuum emission contours (gray solid lines). The black dots mark the position of four embedded continuum sources (see Fig. 1). Blue and red contours show the regions where Δψ > 45° and < −45°, respectively.Dashed gray lines indicate the direction of the E–W and N–S outflows mapped in SiO by BEL18.
Current usage metrics show cumulative count of Article Views (full-text article views including HTML views, PDF and ePub downloads, according to the available data) and Abstracts Views on Vision4Press platform.
Data correspond to usage on the plateform after 2015. The current usage metrics is available 48-96 hours after online publication and is updated daily on week days.
Initial download of the metrics may take a while.