Free Access
Fig. 6
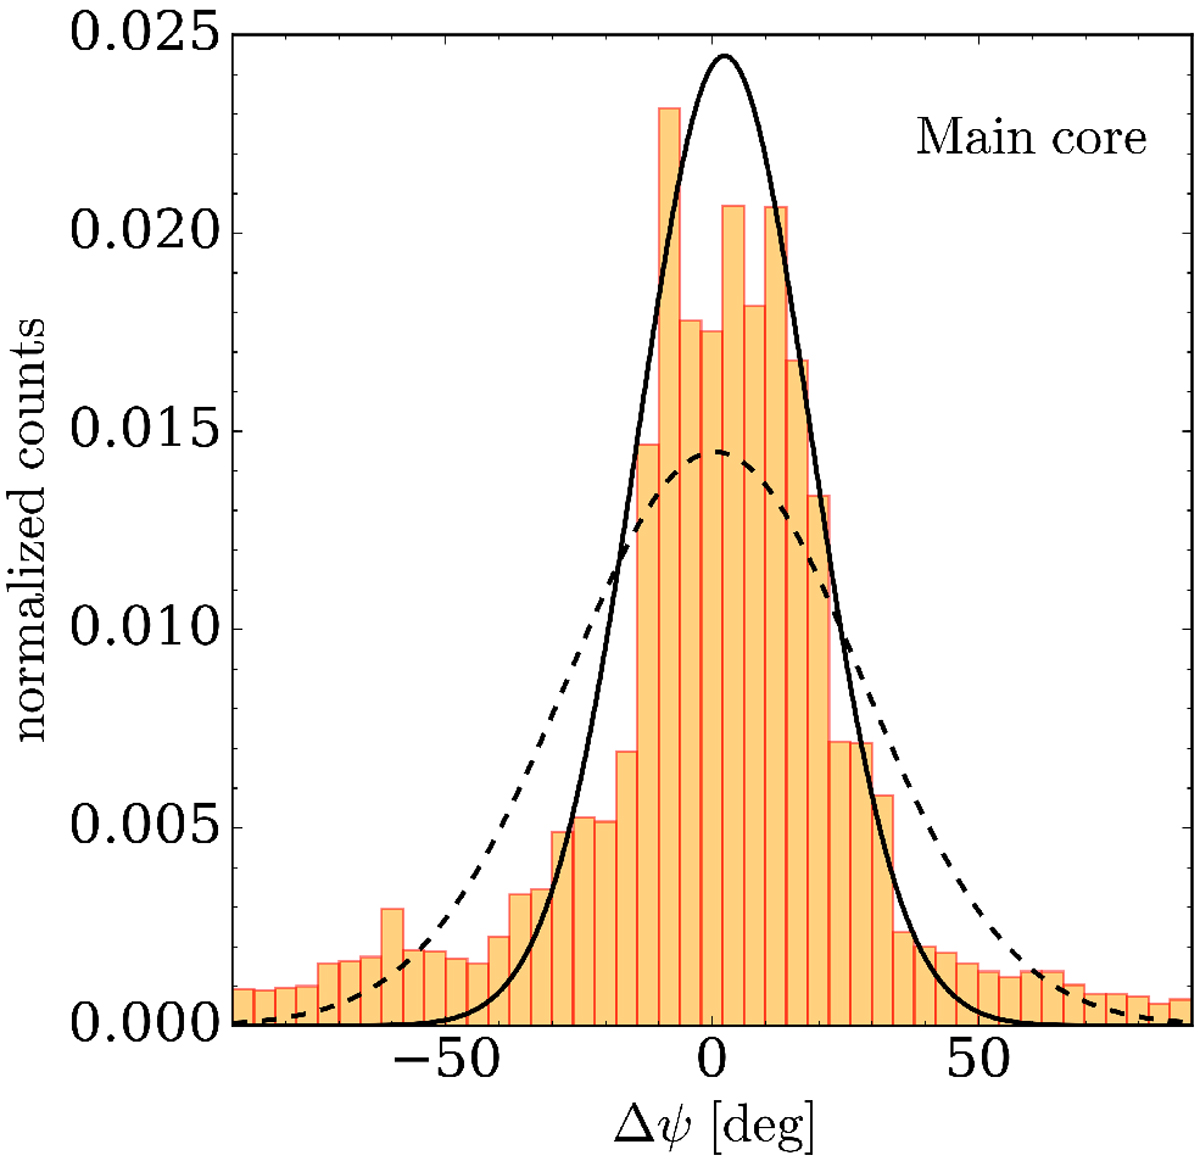
Histogram of the polarization angle residuals for our best model in the region inside the 15σ contour (corresponding to the Main core) of the 1.3 mm dust continuum map. The dashed and solid black lines show two Gaussian fits obtained considering the whole range of Δψ and limited to ±45°, respectively.
Current usage metrics show cumulative count of Article Views (full-text article views including HTML views, PDF and ePub downloads, according to the available data) and Abstracts Views on Vision4Press platform.
Data correspond to usage on the plateform after 2015. The current usage metrics is available 48-96 hours after online publication and is updated daily on week days.
Initial download of the metrics may take a while.