Fig. 5
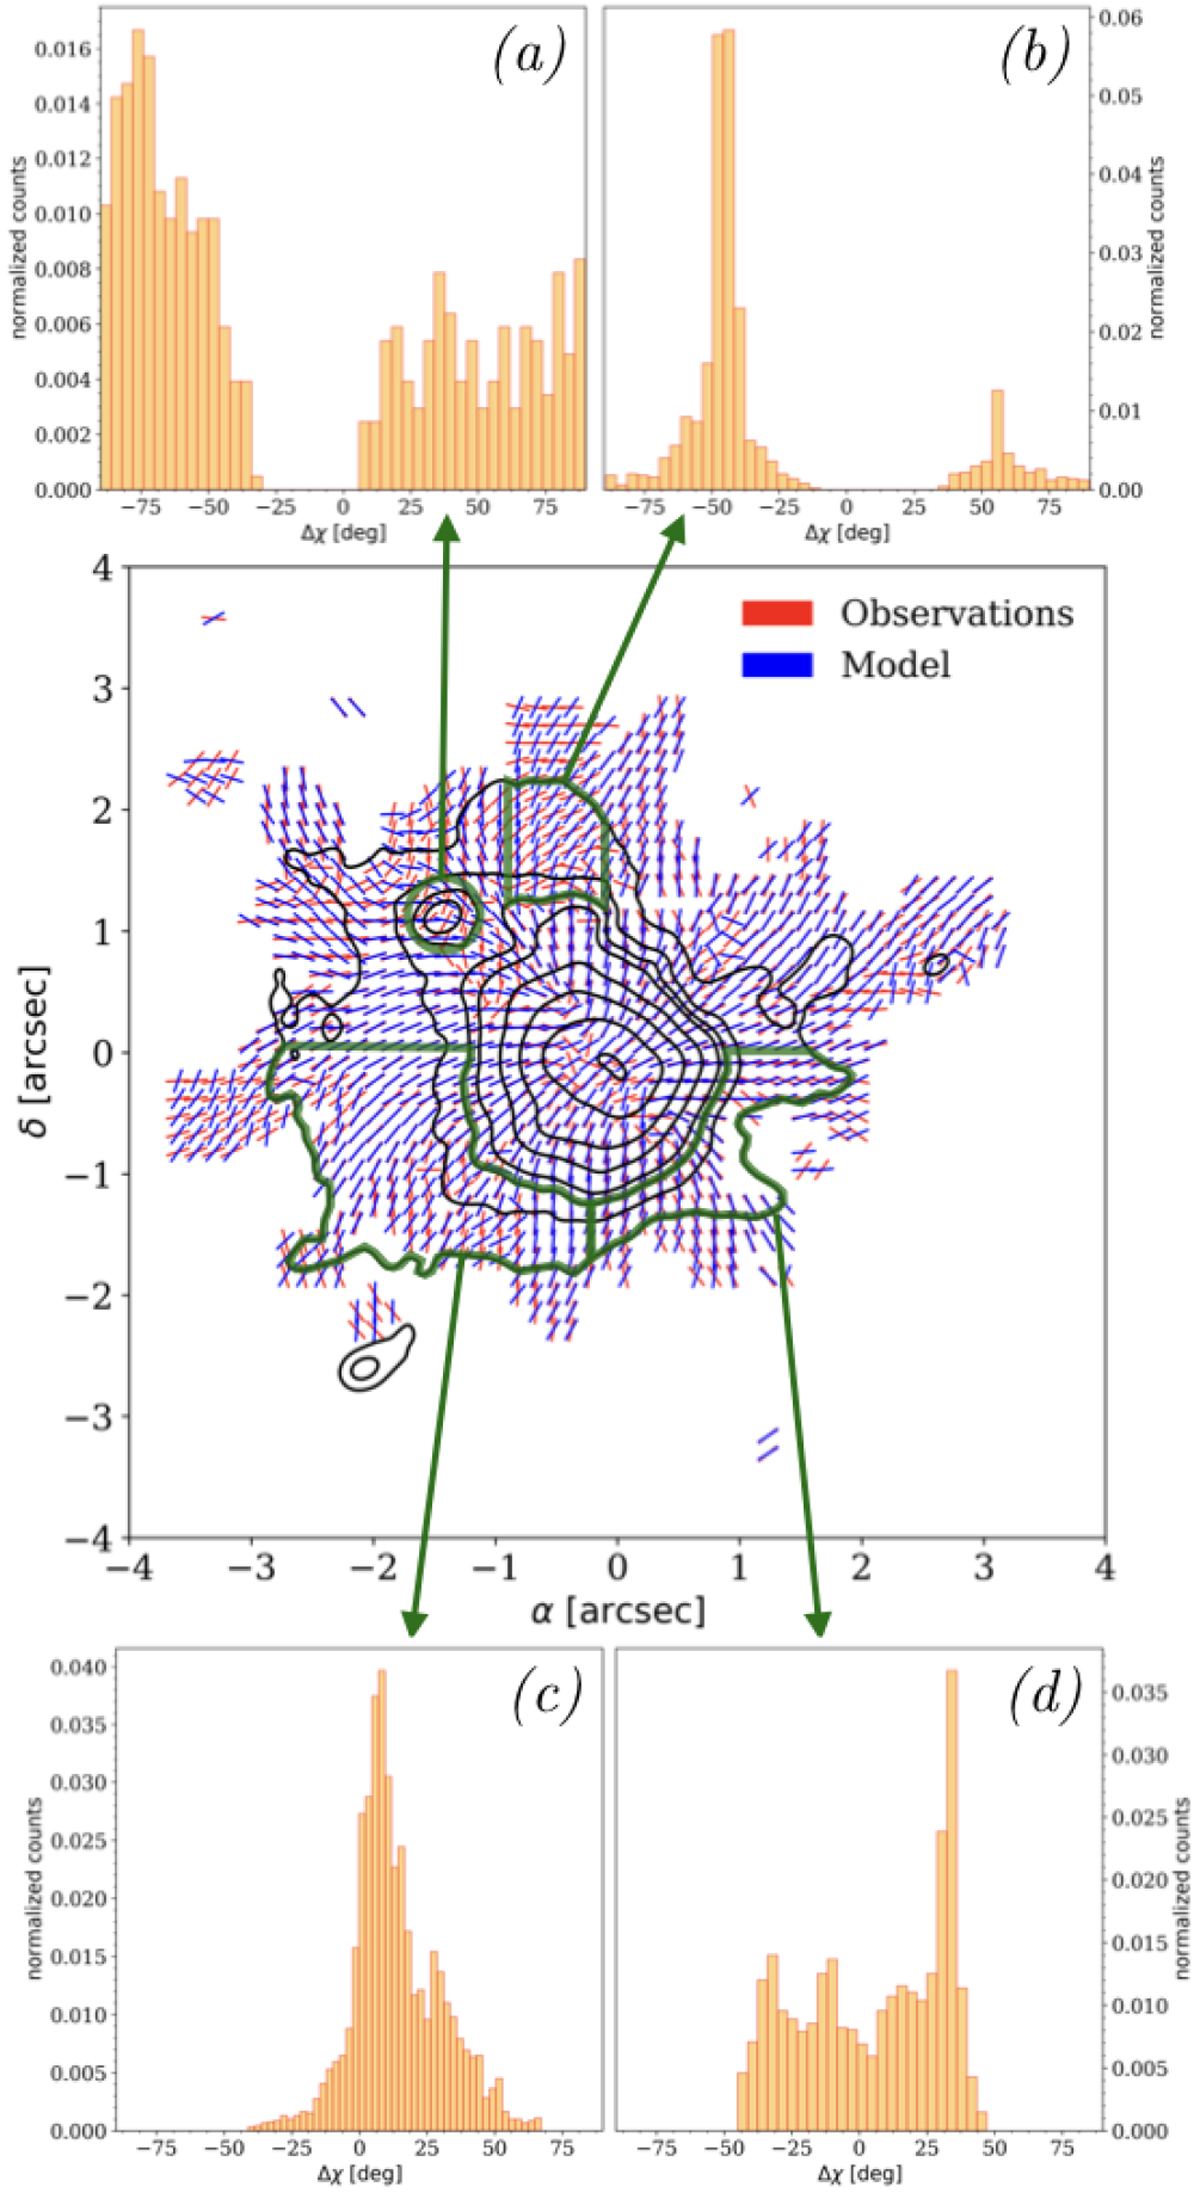
Middle plot: comparison between the observed and the modeled polarization angles superposed to the contours of the 1.3 mm dust continuum emission (see Fig. 4 for details). The four histograms show the polarization angle residuals for the NE core (a), and for the regions associated with two of the outflows mapped in SiO in the core: that associated with the N–S outflow located to the north of the Main core (b), and those associated with the E–W outflow to the southeast (c) and southwest (d) of the Main core (see Sect. 5.4). For the latter regions (b–d), the histograms of the polarization angle residuals have been calculated in the regions encompassing the 5 and 15σ contours.
Current usage metrics show cumulative count of Article Views (full-text article views including HTML views, PDF and ePub downloads, according to the available data) and Abstracts Views on Vision4Press platform.
Data correspond to usage on the plateform after 2015. The current usage metrics is available 48-96 hours after online publication and is updated daily on week days.
Initial download of the metrics may take a while.