Fig. 4
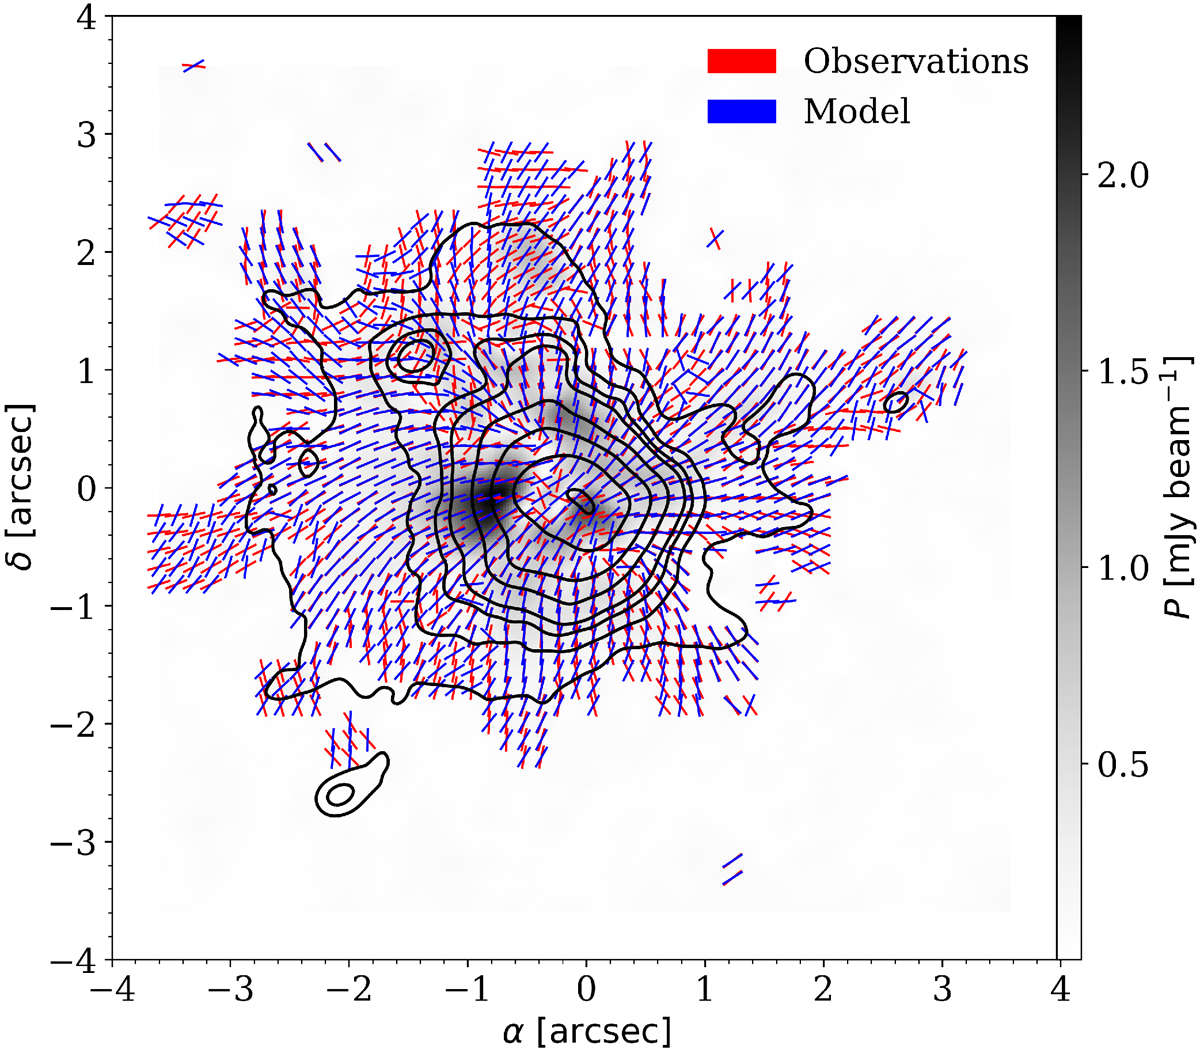
Polarization angles showing the magnetic field direction from observations (red) and the best model (blue: b0 = 0.1, λ = 2.66, ![]() , and
, and ![]() ). The gray-scale map shows the polarized intensity, P, while black contours show the 1.3 mm dust emission at 5, 10, 15, 20, 40, 80, 160, and 300 times
σ, (see Fig. 1 for details). We note that although the magnetic field segments of the observations are shown also for regions below the 5σ
contour, these have not been used for the calculations or the discussion.
). The gray-scale map shows the polarized intensity, P, while black contours show the 1.3 mm dust emission at 5, 10, 15, 20, 40, 80, 160, and 300 times
σ, (see Fig. 1 for details). We note that although the magnetic field segments of the observations are shown also for regions below the 5σ
contour, these have not been used for the calculations or the discussion.
Current usage metrics show cumulative count of Article Views (full-text article views including HTML views, PDF and ePub downloads, according to the available data) and Abstracts Views on Vision4Press platform.
Data correspond to usage on the plateform after 2015. The current usage metrics is available 48-96 hours after online publication and is updated daily on week days.
Initial download of the metrics may take a while.