Fig. 3
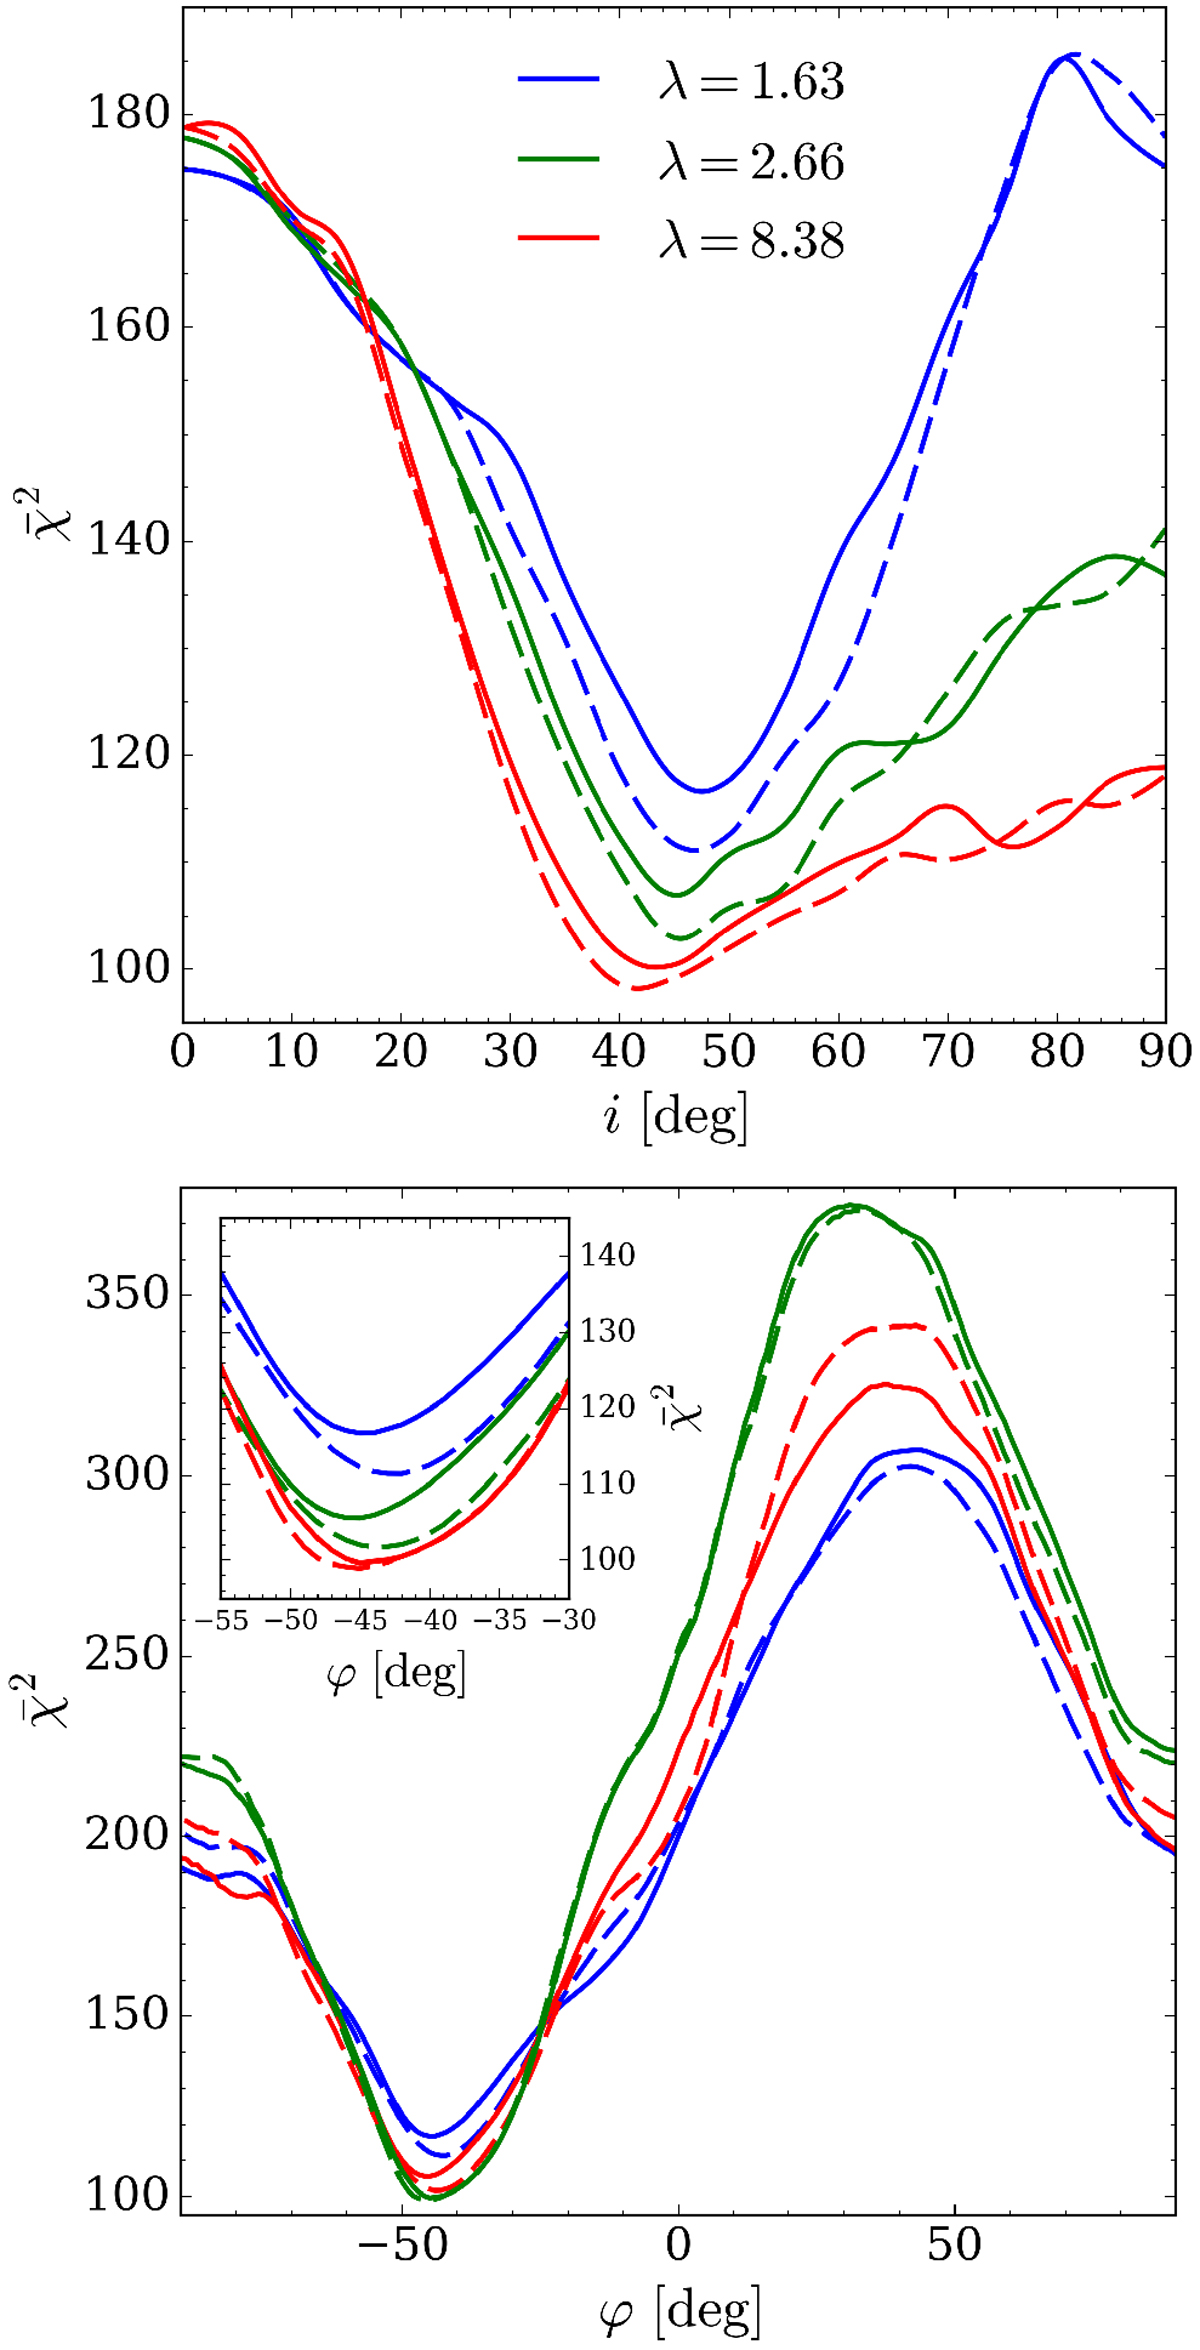
Top panel: minimum reduced chi squared versus the inclination, i, of the model for three different values of the mass-to-flux ratio, λ, and b0 = 0.1. Solid (dashed) lines show ![]() for positive (negative) values of i. For a better comparison, negative inclinations are shown in absolute value. Bottom panel: reduced chi squared versus the orientation on the plane of the sky for
i = − 45°. The inset shows a zoom around the minimum of
for positive (negative) values of i. For a better comparison, negative inclinations are shown in absolute value. Bottom panel: reduced chi squared versus the orientation on the plane of the sky for
i = − 45°. The inset shows a zoom around the minimum of ![]() . The color coding follows that of the upper panel.
. The color coding follows that of the upper panel.
Current usage metrics show cumulative count of Article Views (full-text article views including HTML views, PDF and ePub downloads, according to the available data) and Abstracts Views on Vision4Press platform.
Data correspond to usage on the plateform after 2015. The current usage metrics is available 48-96 hours after online publication and is updated daily on week days.
Initial download of the metrics may take a while.