Fig. 2
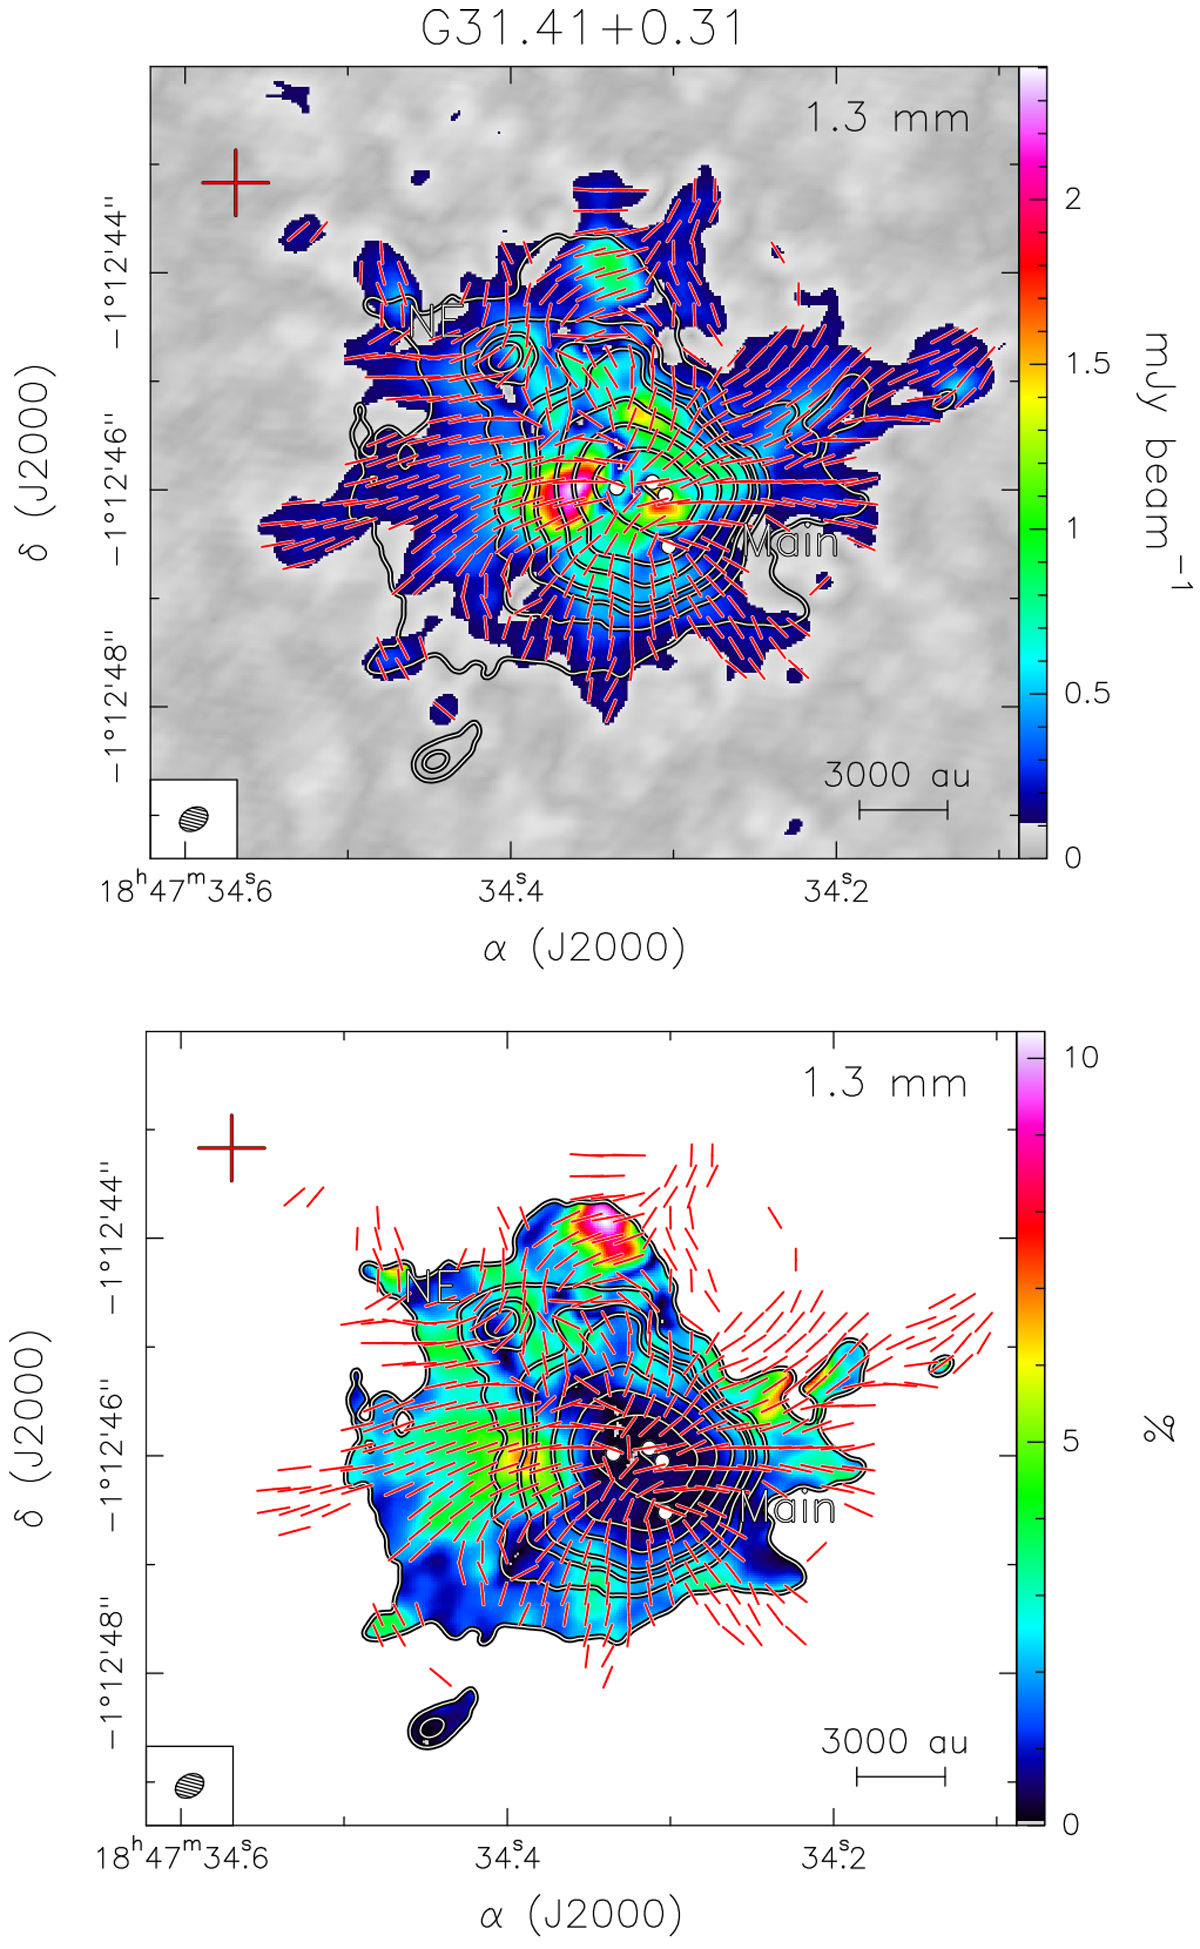
Top panel: linearly polarized intensity P (colors) and dust continuum emission map (contours) at 1.3 mm in G31. Polarized intensity ranges from 0.11 to 2.4 mJy beam−1. Bottom panel: polarization fraction p (colors) anddust continuum emission map (contours) at 1.3 mm. Polarization fraction ranges from 0.1 to 13%. The red thick segments in both panels indicate the magnetic field lines. Segments are shown every eight pixels. The synthesized beam is shown in the lower left-hand corner. Contours and symbols are the same as in Fig. 1.
Current usage metrics show cumulative count of Article Views (full-text article views including HTML views, PDF and ePub downloads, according to the available data) and Abstracts Views on Vision4Press platform.
Data correspond to usage on the plateform after 2015. The current usage metrics is available 48-96 hours after online publication and is updated daily on week days.
Initial download of the metrics may take a while.