Fig. B.1
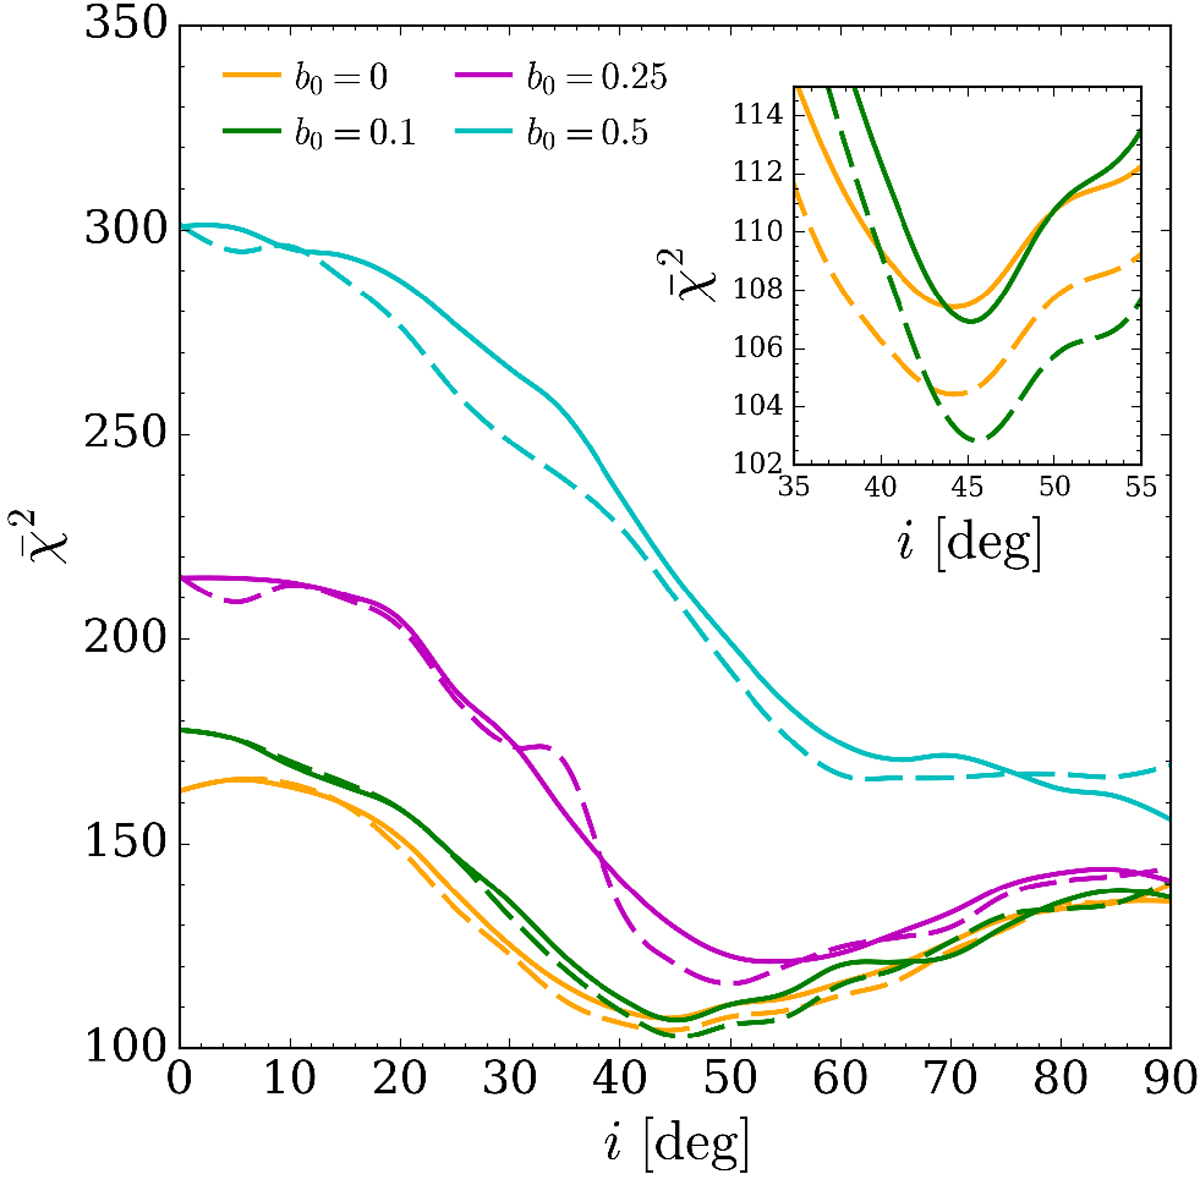
Minimum reduced chi squared versus the inclination, i, of the model for λ = 2.66 and increasing toroidal component. Solid (dashed) lines show ![]() for positive (negative) values of i. For better comparison, negative inclinations are shown in absolute value. The inset shows a zoom around the minimum of
for positive (negative) values of i. For better comparison, negative inclinations are shown in absolute value. The inset shows a zoom around the minimum of
![]() for the cases b0 = 0 and 0.1.
for the cases b0 = 0 and 0.1.
Current usage metrics show cumulative count of Article Views (full-text article views including HTML views, PDF and ePub downloads, according to the available data) and Abstracts Views on Vision4Press platform.
Data correspond to usage on the plateform after 2015. The current usage metrics is available 48-96 hours after online publication and is updated daily on week days.
Initial download of the metrics may take a while.