Free Access
Fig. A.1
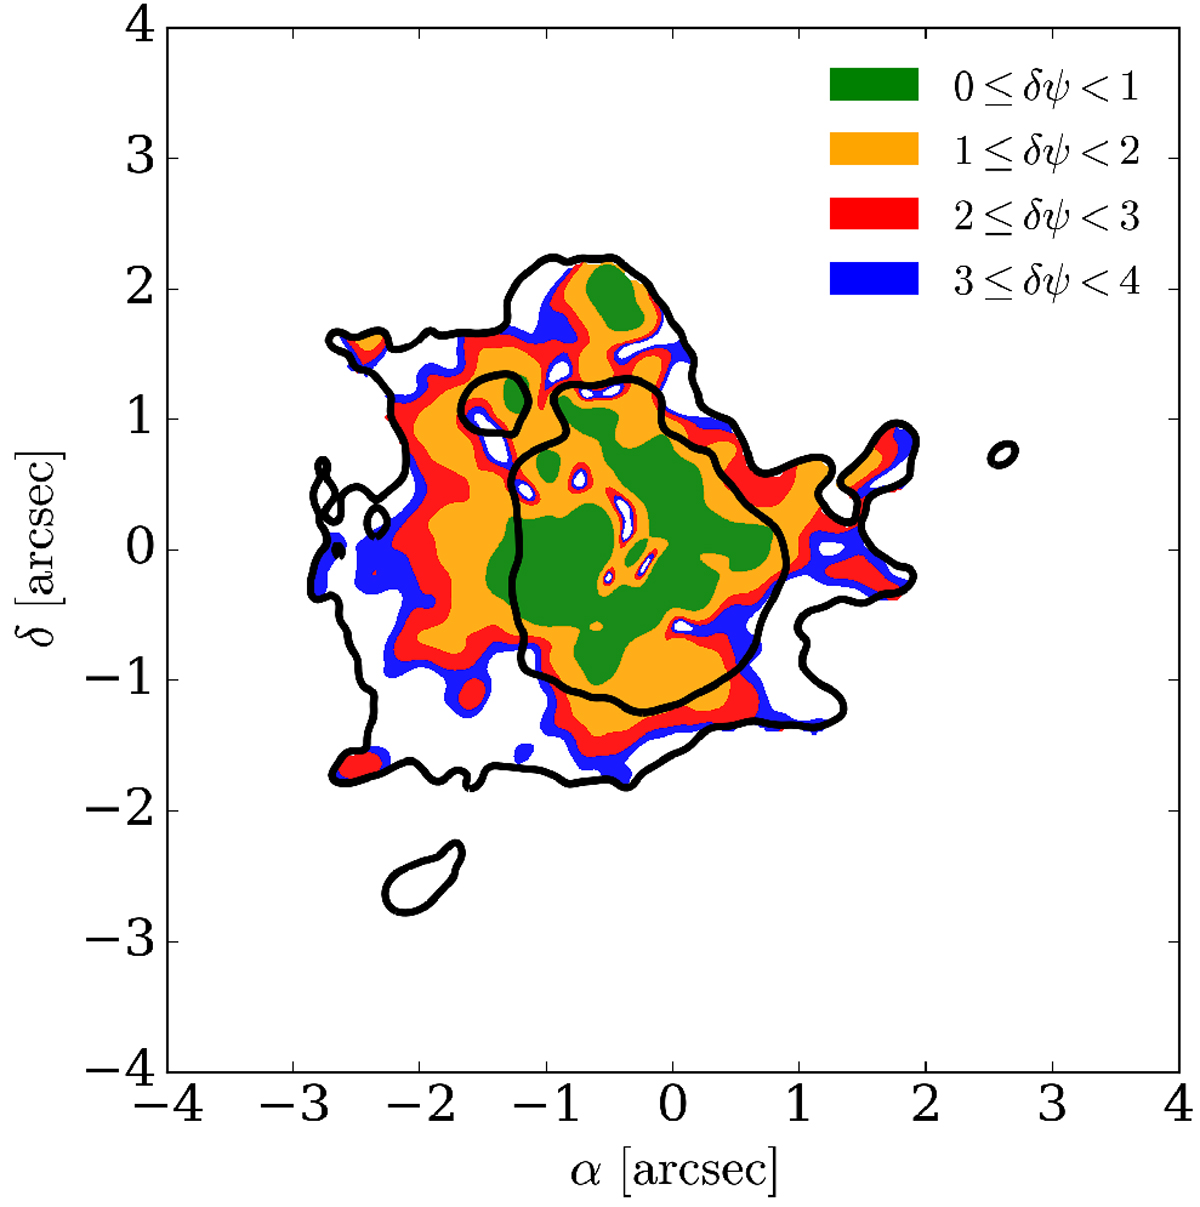
Map of the errors on the observed polarization angles according to the color-coding shown in the legend. Black contours show the 5σ and 15σ levels of the 1.3 mm dust continuum emission. White regions inside the 5σ contour referto δψobs ≥ 4°.
Current usage metrics show cumulative count of Article Views (full-text article views including HTML views, PDF and ePub downloads, according to the available data) and Abstracts Views on Vision4Press platform.
Data correspond to usage on the plateform after 2015. The current usage metrics is available 48-96 hours after online publication and is updated daily on week days.
Initial download of the metrics may take a while.