Fig. 1
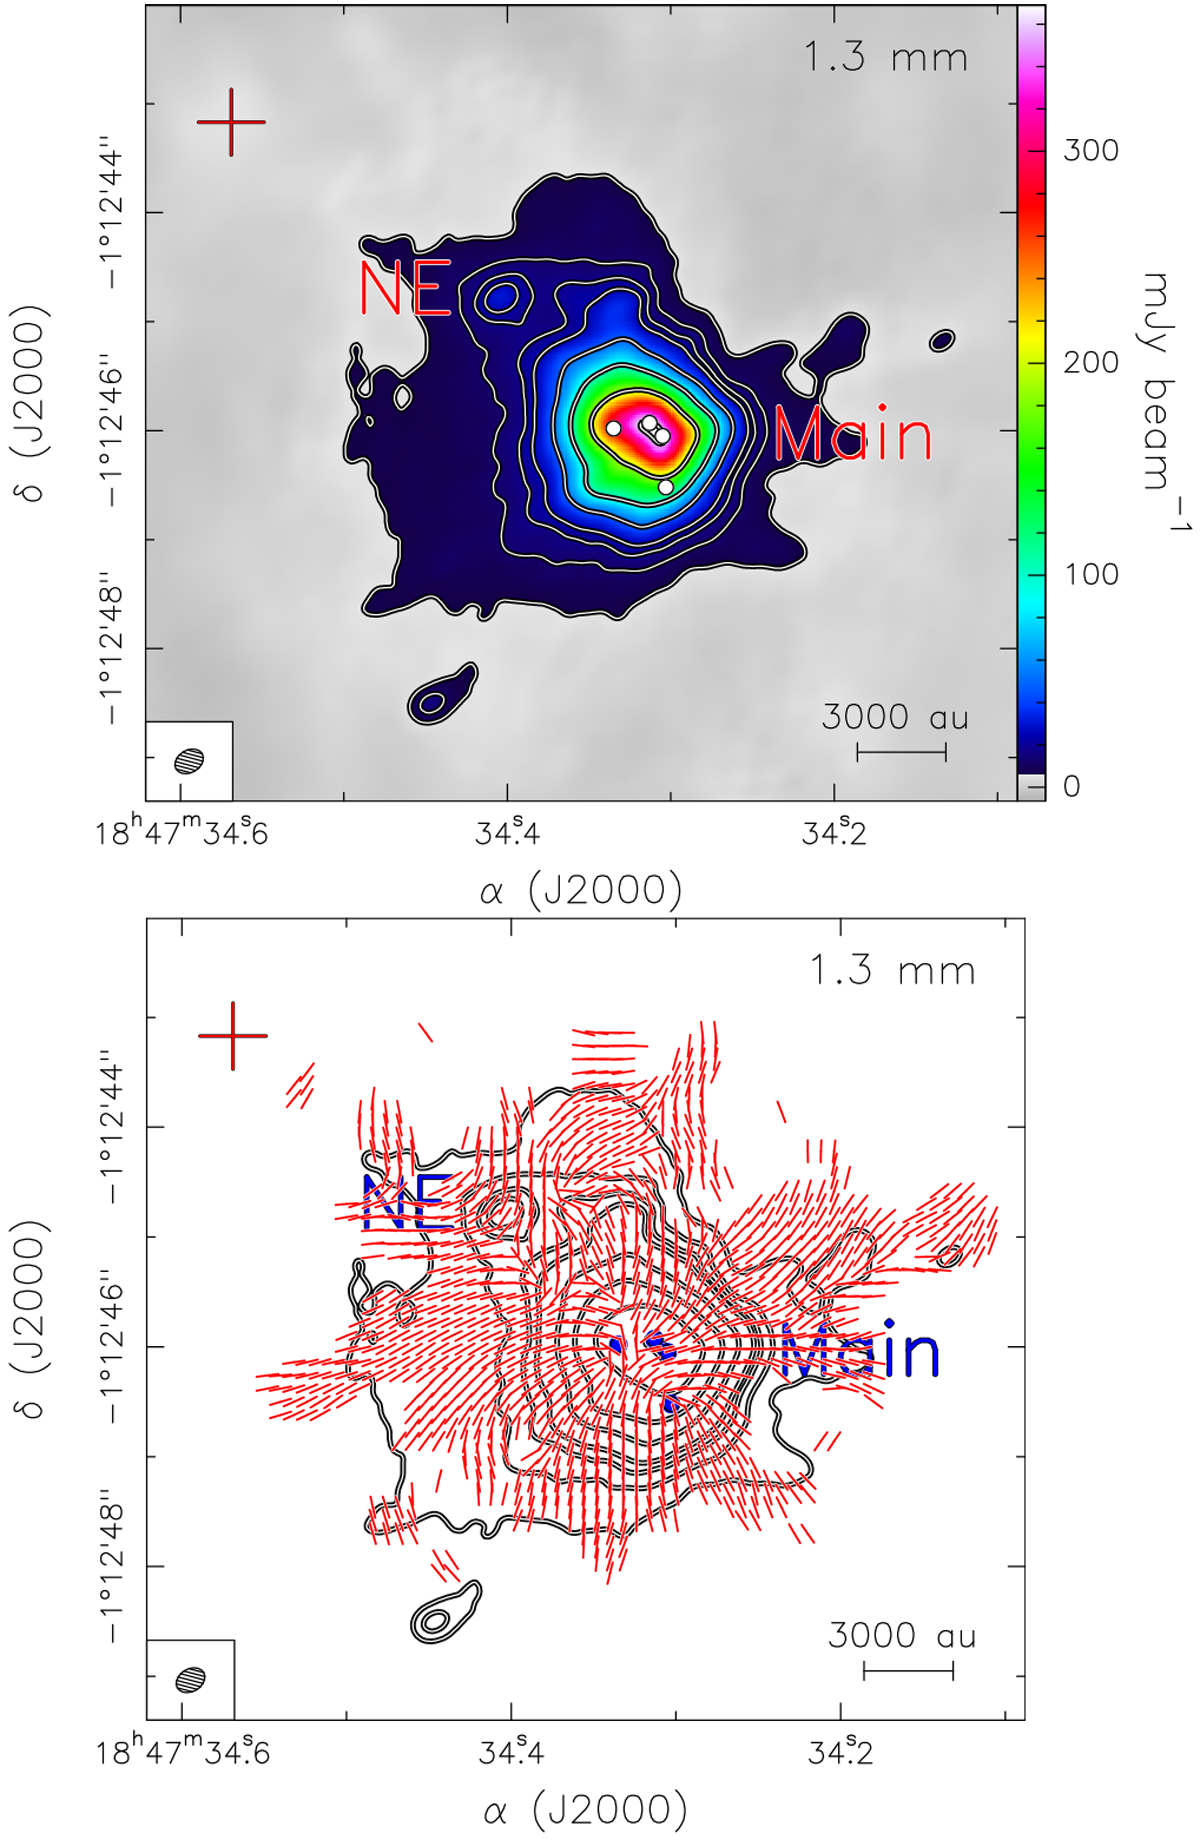
Top panel: 1.3 mm ALMA continuum emission map of the HMC G31. The contours are 5, 10, 15, 20, 40, 80, 160, and 300 times σ, where 1σ is 1.2 mJy beam−1. The white dots mark the position of four embedded continuum sources observed at 1.4 mm and 3.5 mm (Beltrán et al., in prep.). The red cross indicates the position of the UC H II region imaged by Cesaroni et al. (1994). The synthesized beam is shown in the lower left-hand corner. Bottom panel: magnetic field segments (red lines), obtained by rotating 90° the polarization segments, overlapped on the 1.3 mm continuum emission map (contours). The segments are sampled following Nyquist sampling (every five pixels).
Current usage metrics show cumulative count of Article Views (full-text article views including HTML views, PDF and ePub downloads, according to the available data) and Abstracts Views on Vision4Press platform.
Data correspond to usage on the plateform after 2015. The current usage metrics is available 48-96 hours after online publication and is updated daily on week days.
Initial download of the metrics may take a while.