Fig. 6.
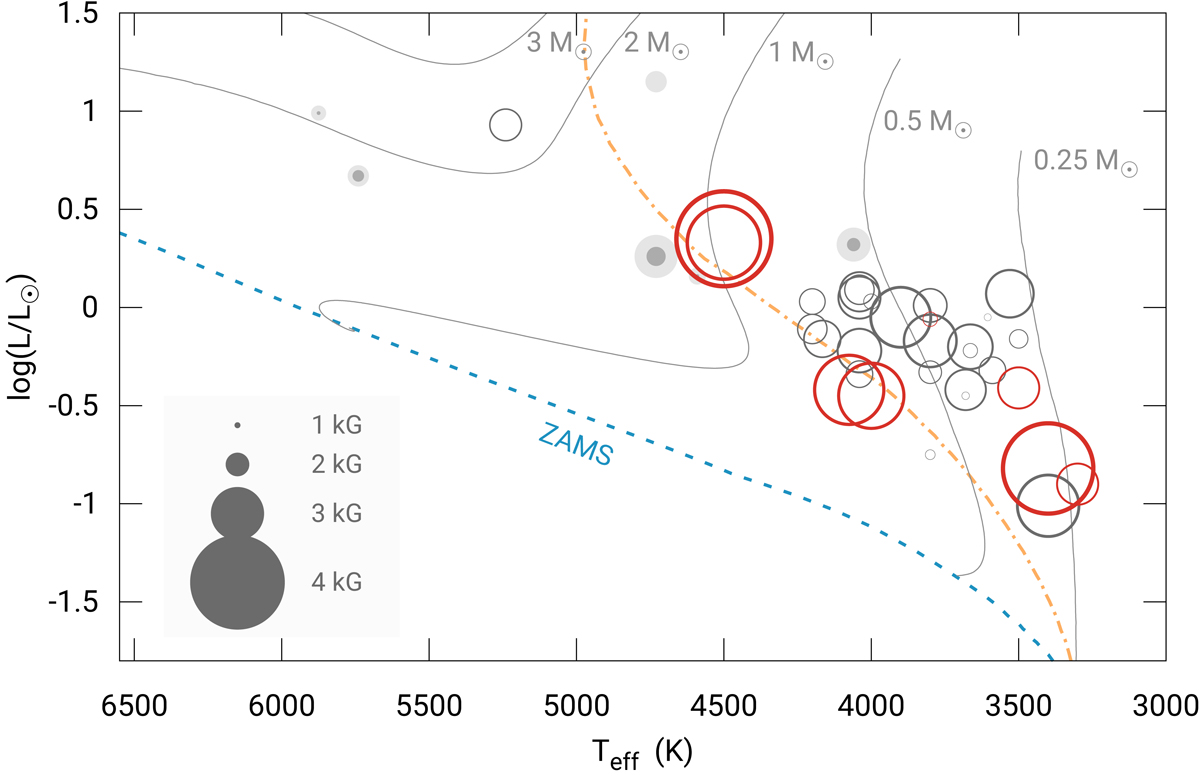
HR diagram summarising near-infrared spectroscopic magnetic field measurements of T Tauri stars. The filled grey circles represent the intermediate-mass T Tauri stars sample from Lavail et al. (2017). The two shades of grey represent results obtained for two different sets of spectral lines. The open dark circles show the samples from Johns-Krull (2007), Yang et al. (2008), and Yang & Johns-Krull (2011), and the open red circles display the average measurement for the sample presented in this work. The radius of the circles is proportional to ⟨B⟩2. The ZAMS is plotted with dashed blue line, the limit between fully and partially convective regimes is shown with the dash-dotted yellow curve, and evolutionary tracks for different masses are plotted with thin grey lines.
Current usage metrics show cumulative count of Article Views (full-text article views including HTML views, PDF and ePub downloads, according to the available data) and Abstracts Views on Vision4Press platform.
Data correspond to usage on the plateform after 2015. The current usage metrics is available 48-96 hours after online publication and is updated daily on week days.
Initial download of the metrics may take a while.