Fig. 3.
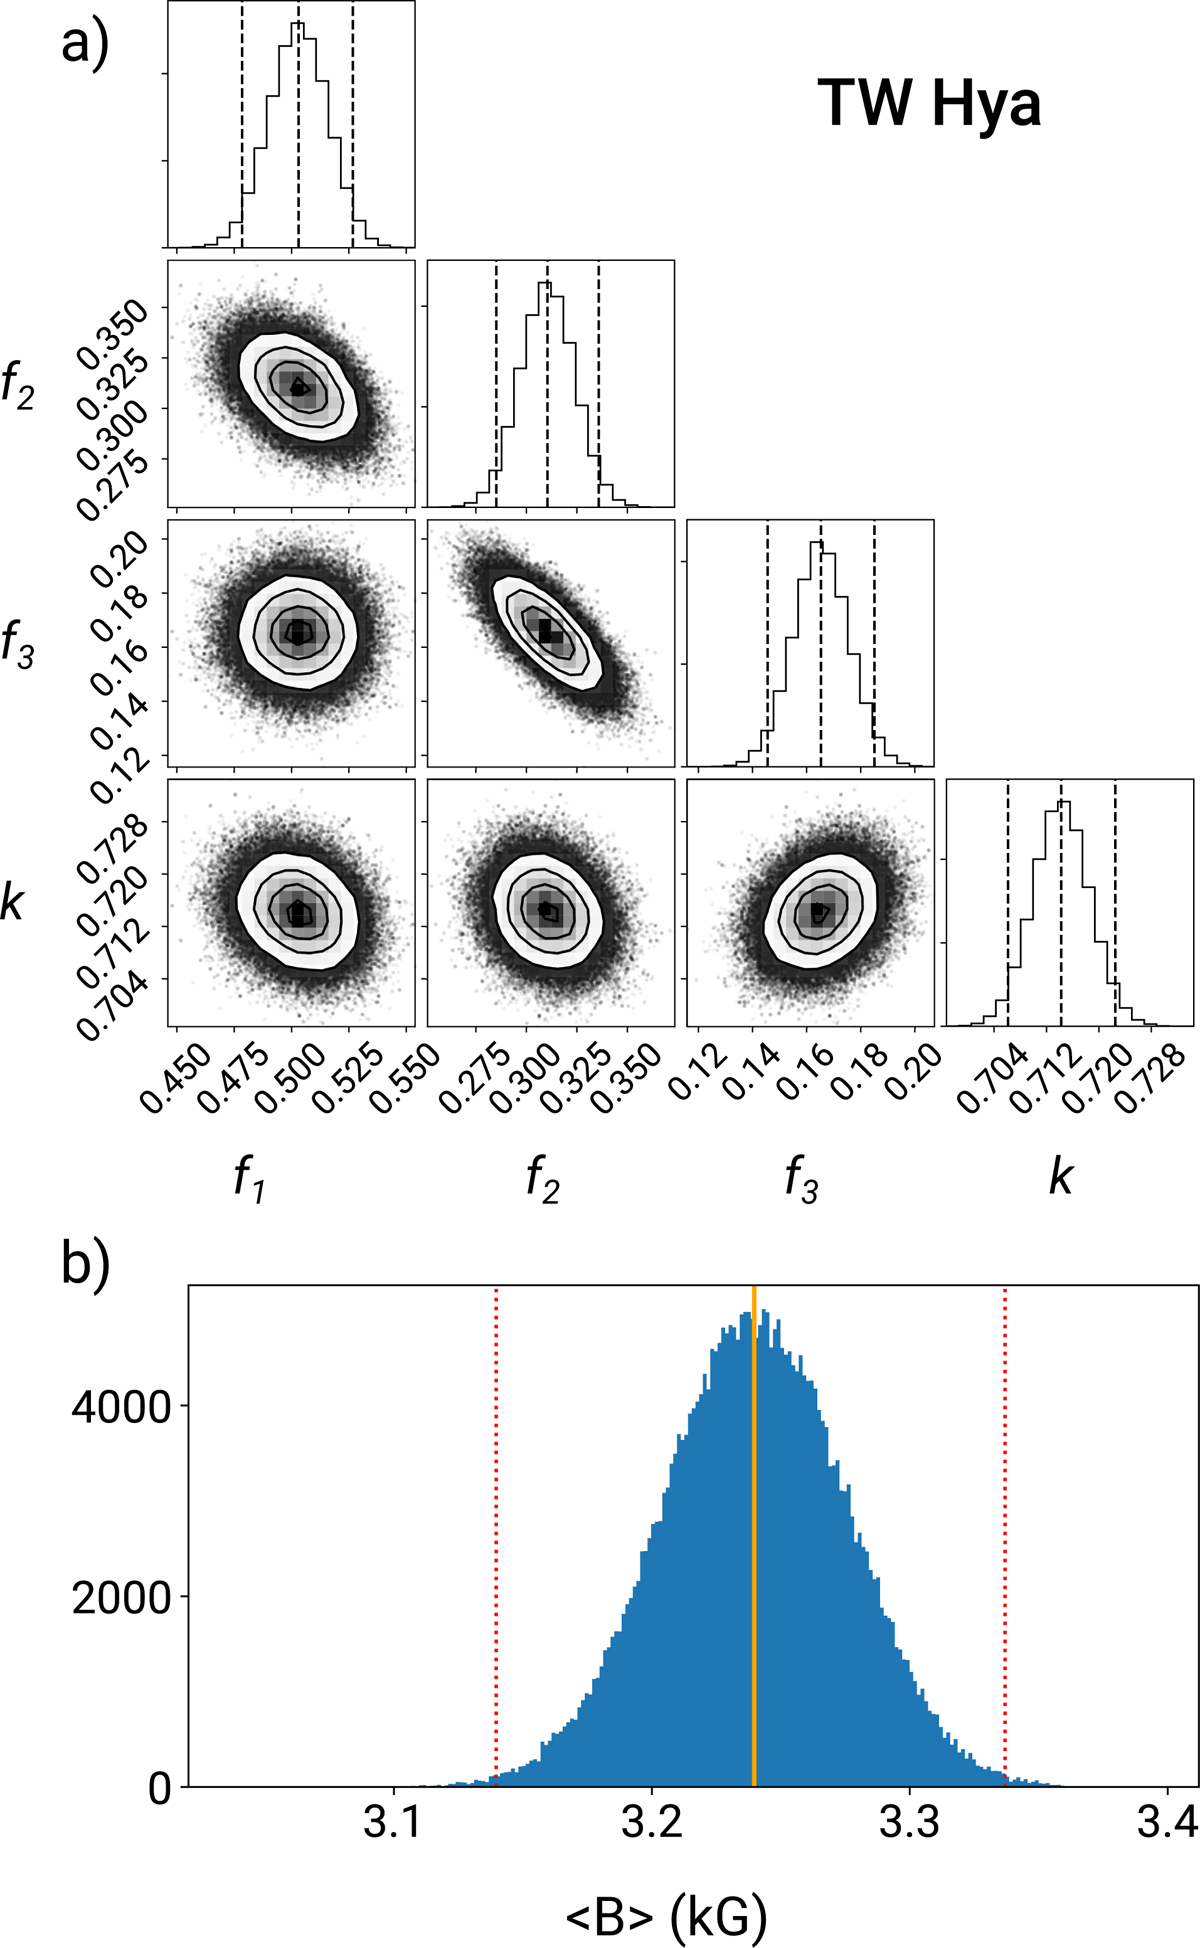
Illustration of the MCMC analysis for the spectrum of TW Hya obtained on 2009-02-12 using Model 4. The corner plot at the top shows the posterior distribution of the model parameters (magnetic filling factors fi and the scaling factor k). The bottom histogram displays the resulting posterior distribution of the magnetic field modulus ⟨B⟩, overplotted with its median value (yellow thick line) and the limits of the 3σ confidence interval (red dashed lines).
Current usage metrics show cumulative count of Article Views (full-text article views including HTML views, PDF and ePub downloads, according to the available data) and Abstracts Views on Vision4Press platform.
Data correspond to usage on the plateform after 2015. The current usage metrics is available 48-96 hours after online publication and is updated daily on week days.
Initial download of the metrics may take a while.