Fig. 3
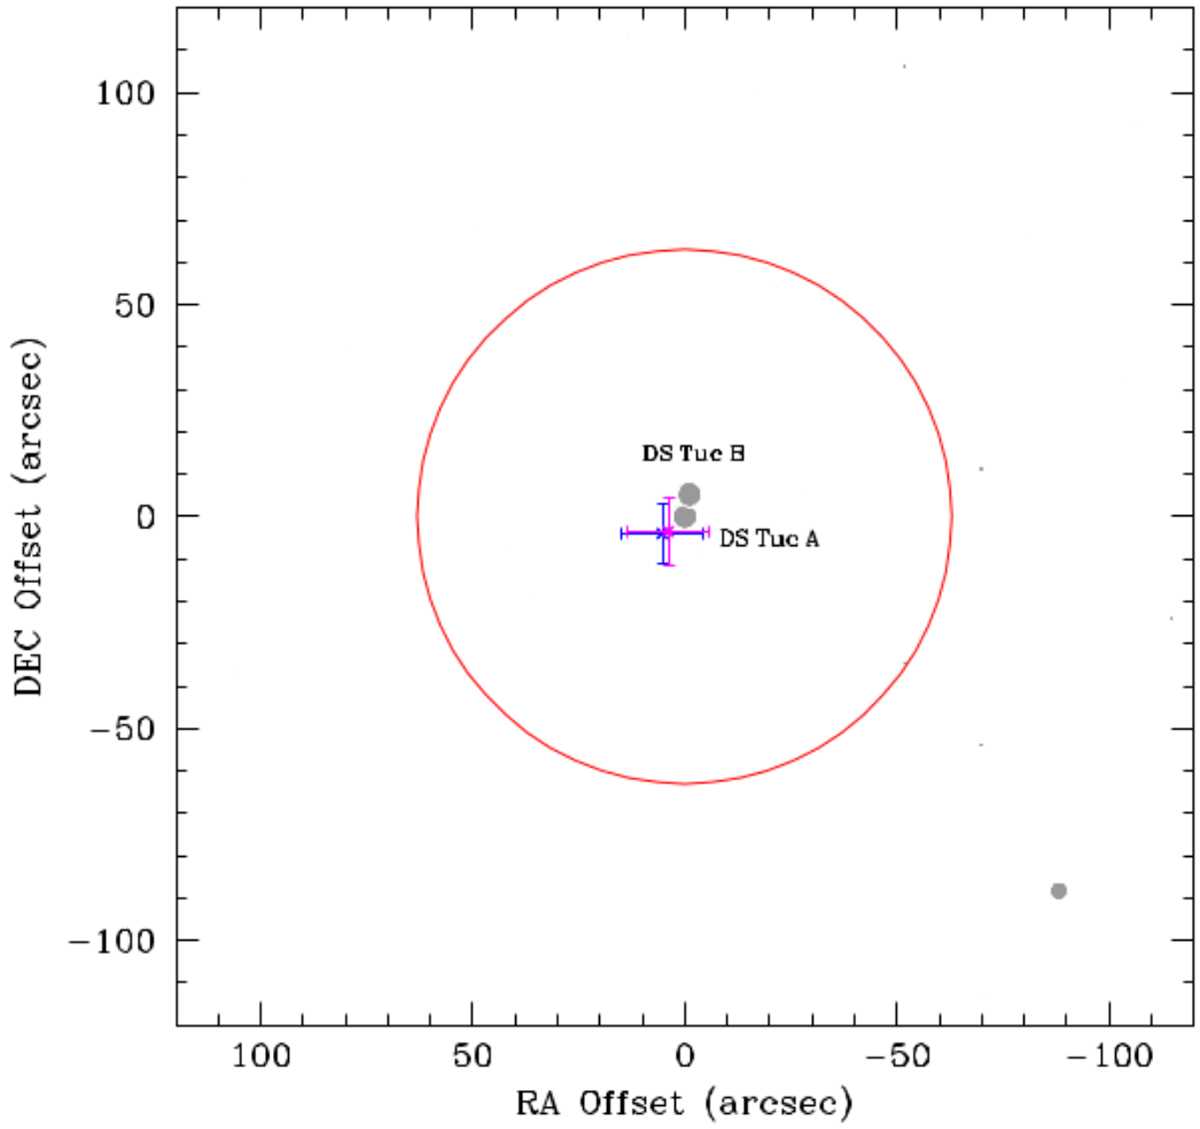
Difference image centroid offset for DS Tuc A from TESS observations. The grey dots indicate the position of the sources in the field, the red circle indicates the extension of the photometric aperture, while the magenta and blue crosses with error bars represent the offset with respect to the TESS out-of-transit images and the coordinates of the target from Gaia DR2.
Current usage metrics show cumulative count of Article Views (full-text article views including HTML views, PDF and ePub downloads, according to the available data) and Abstracts Views on Vision4Press platform.
Data correspond to usage on the plateform after 2015. The current usage metrics is available 48-96 hours after online publication and is updated daily on week days.
Initial download of the metrics may take a while.