Open Access
Fig. 6
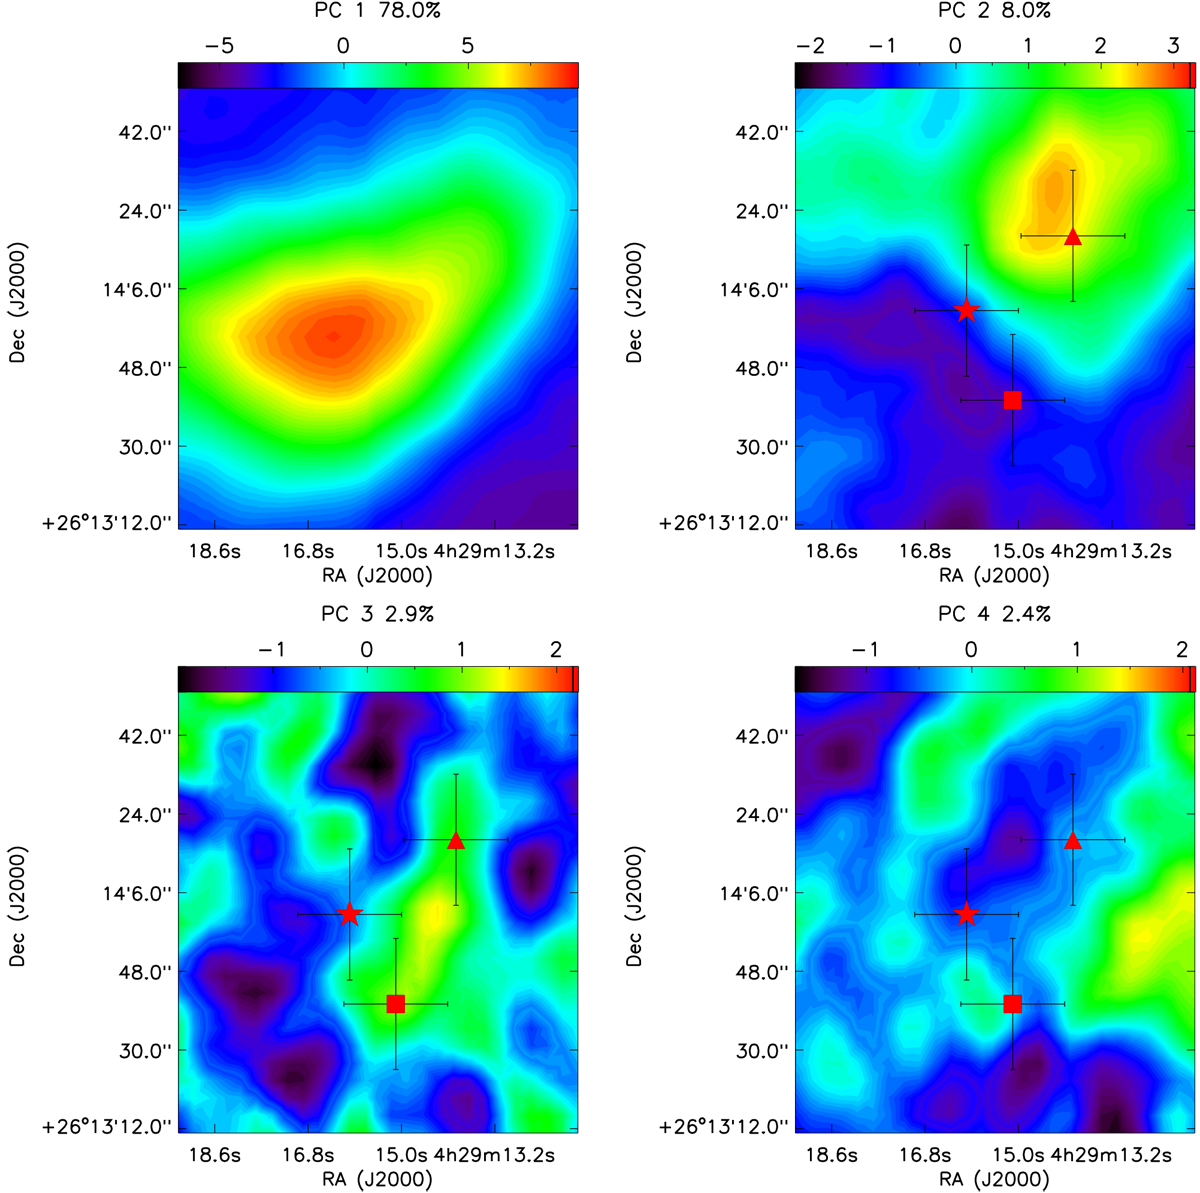
Maps of first four principal components obtained by performing PCA. The percentages represent the amount of correlation that can be reproduced by the single principal component. The red triangle represents the CH3OH peak, the asterisk is the c-C3H2 peak, and the square the is HNCO peak.
Current usage metrics show cumulative count of Article Views (full-text article views including HTML views, PDF and ePub downloads, according to the available data) and Abstracts Views on Vision4Press platform.
Data correspond to usage on the plateform after 2015. The current usage metrics is available 48-96 hours after online publication and is updated daily on week days.
Initial download of the metrics may take a while.