Fig. 5
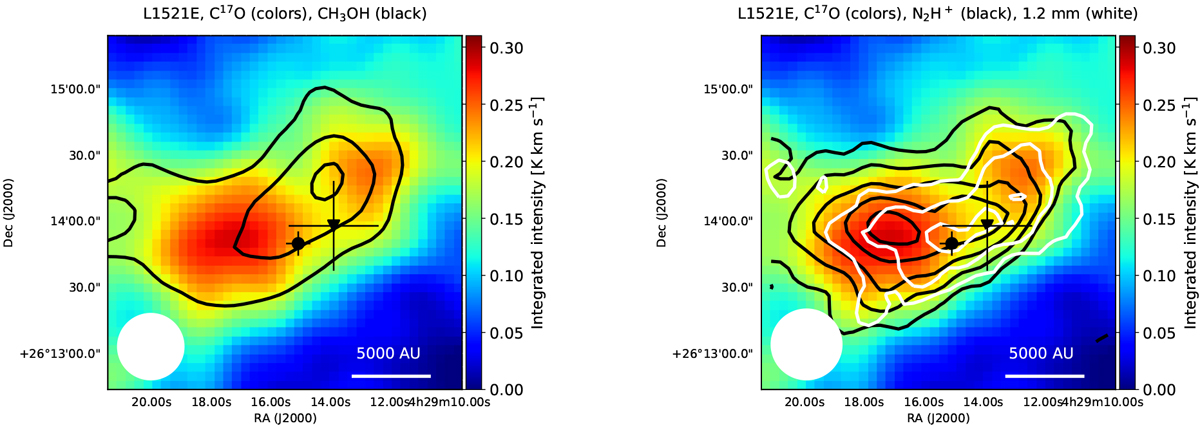
Structure of L1521E. Left: integrated intensity of CH3OH (black contours) overplotted on integrated intensity of C17O. The black dot shows the peak of the 1.2 mm emission. The black triangle shows the peak of the H2 column density derived from the Herschel/SPIRE data. The CH3OH contour levels start from 6σ rms in steps of 6σ rms, with a 3σ rms level of 0.07 K km s−1. Right: integrated intensity of N2H+ (black contours) and distribution of 1.2 mm emission (white contours) overplotted on integrated intensity of C17O. The black dot shows the peak of the 1.2 mm emission. The black triangle shows the peak of the H2 column density derived from the Herschel/SPIRE data. The N2H+ contour levels start from 6σ rms in steps of 4σ rms, with 3σ rms level of 0.08 K km s−1. For the 1.2 mm data the contours start from 6σ rms in steps of 3σ rms with a 3σ rms level of 5.38 mJy.
Current usage metrics show cumulative count of Article Views (full-text article views including HTML views, PDF and ePub downloads, according to the available data) and Abstracts Views on Vision4Press platform.
Data correspond to usage on the plateform after 2015. The current usage metrics is available 48-96 hours after online publication and is updated daily on week days.
Initial download of the metrics may take a while.