Fig. 4
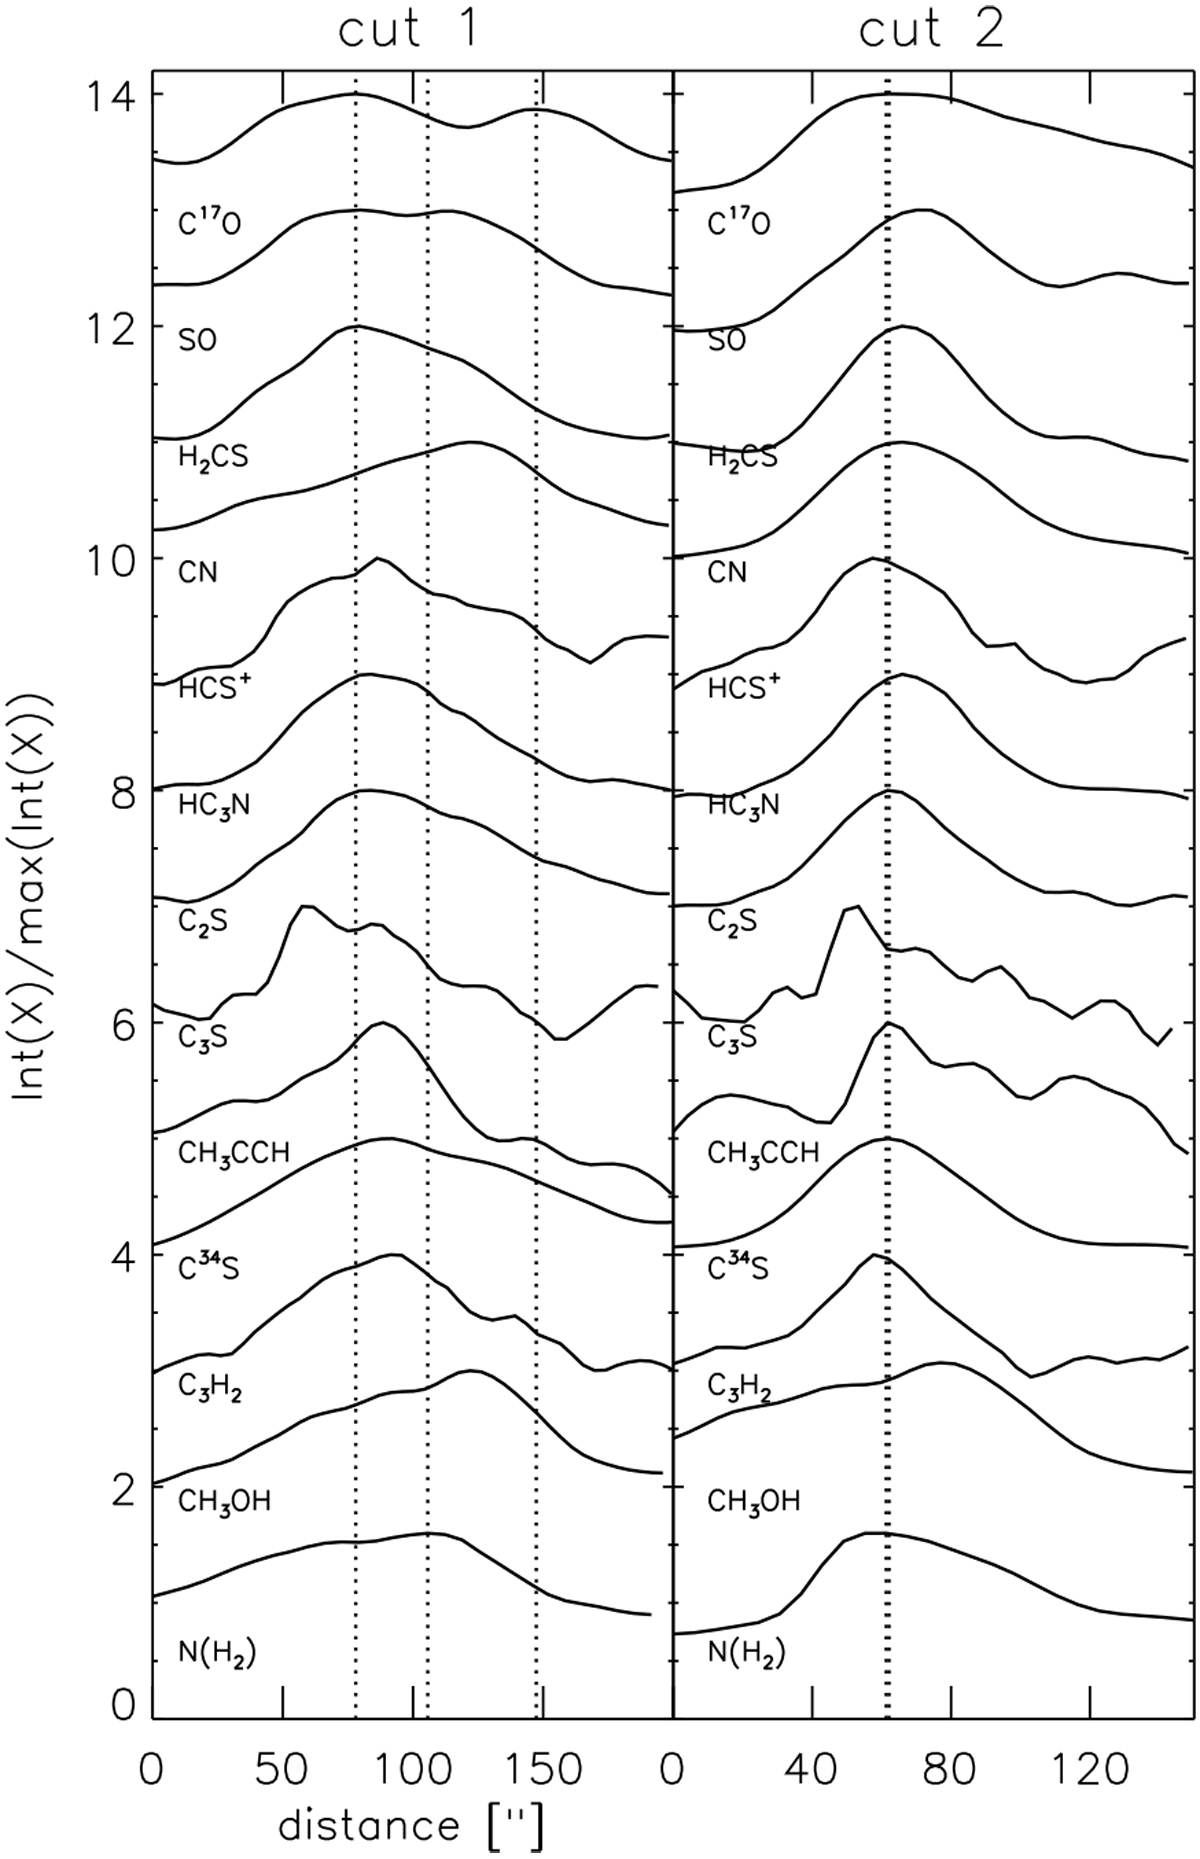
Left: intensity cuts of selected molecules extracted along line crossing the two C17O peaks (close to c-C3H2 and CH3OH peaks) for various species (cut 1 in Fig. 1). Right: intensity cuts extracted along a line perpendicular to other cut and crosses Herschel dust peak (cut 2 in Fig. 1). The intensity values (y-axis) are normalized to the maximum value for each species, and a constant has been added to compare the normalized intensity distributions of the different species. The vertical dotted lines show the locations of the C17O and N(H2) peaks.
Current usage metrics show cumulative count of Article Views (full-text article views including HTML views, PDF and ePub downloads, according to the available data) and Abstracts Views on Vision4Press platform.
Data correspond to usage on the plateform after 2015. The current usage metrics is available 48-96 hours after online publication and is updated daily on week days.
Initial download of the metrics may take a while.