Fig. 2
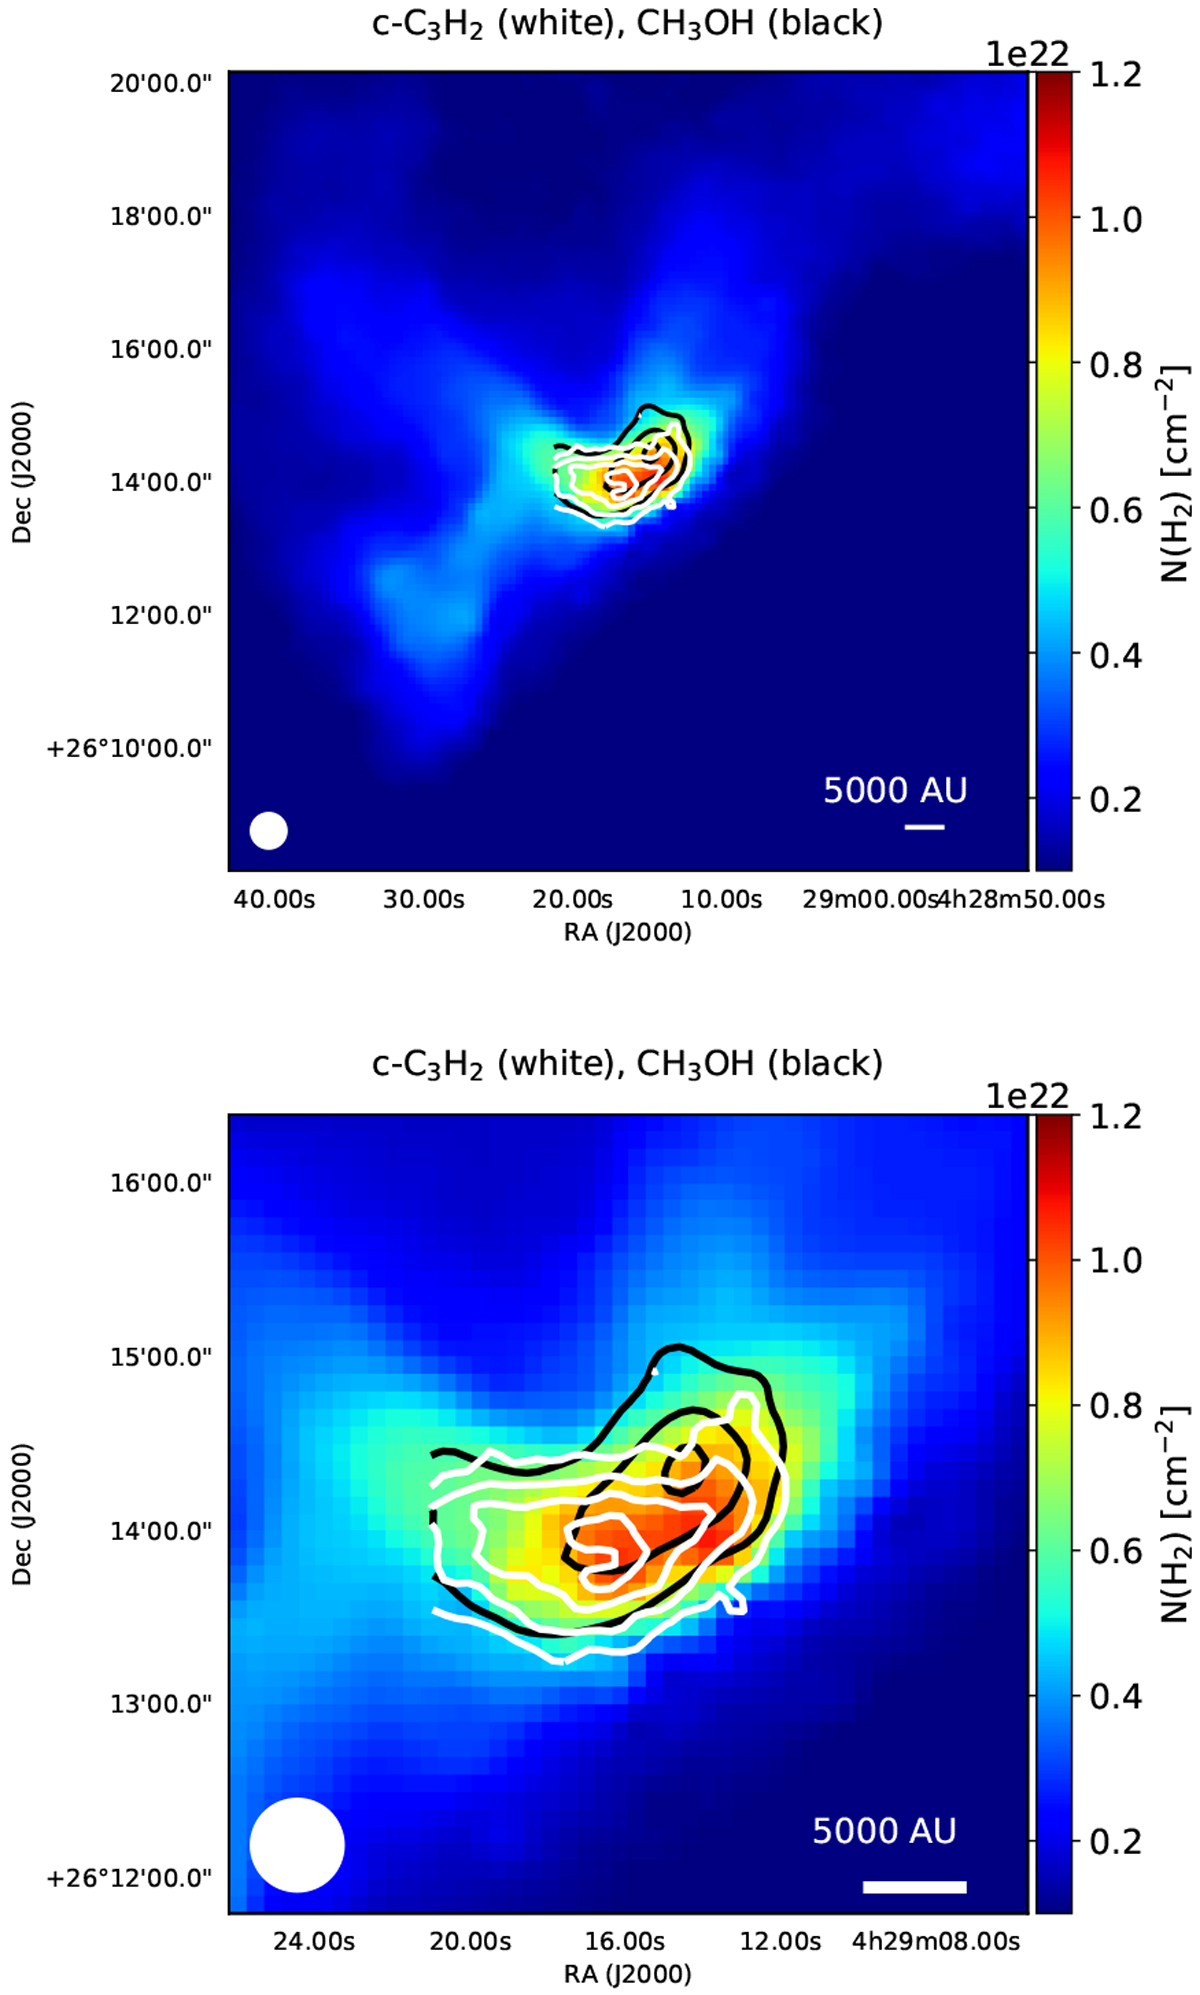
Spatial distribution of c-C3H2 20,2 − 11,1 (white contours) and CH3OH (E2) (black contours). These are shown as detected toward L1521E overplotted on the N(H2) map which was derived from Herschel/SPIRE (color map), showing the large-scale environment of L1521E (top) and the spatial structure of molecular line emission close to the center of the core (bottom). The two overplotted lines show the location of the cuts along which the line intensities shown in Fig. 4 were extracted. The contour levels start from 6σ rms in steps of 6σ rms, with 3σ rms levels of 0.07 and 0.06 K km s−1 for CH3OH and c-C3H2, respectively.
Current usage metrics show cumulative count of Article Views (full-text article views including HTML views, PDF and ePub downloads, according to the available data) and Abstracts Views on Vision4Press platform.
Data correspond to usage on the plateform after 2015. The current usage metrics is available 48-96 hours after online publication and is updated daily on week days.
Initial download of the metrics may take a while.