Open Access
Fig. 12
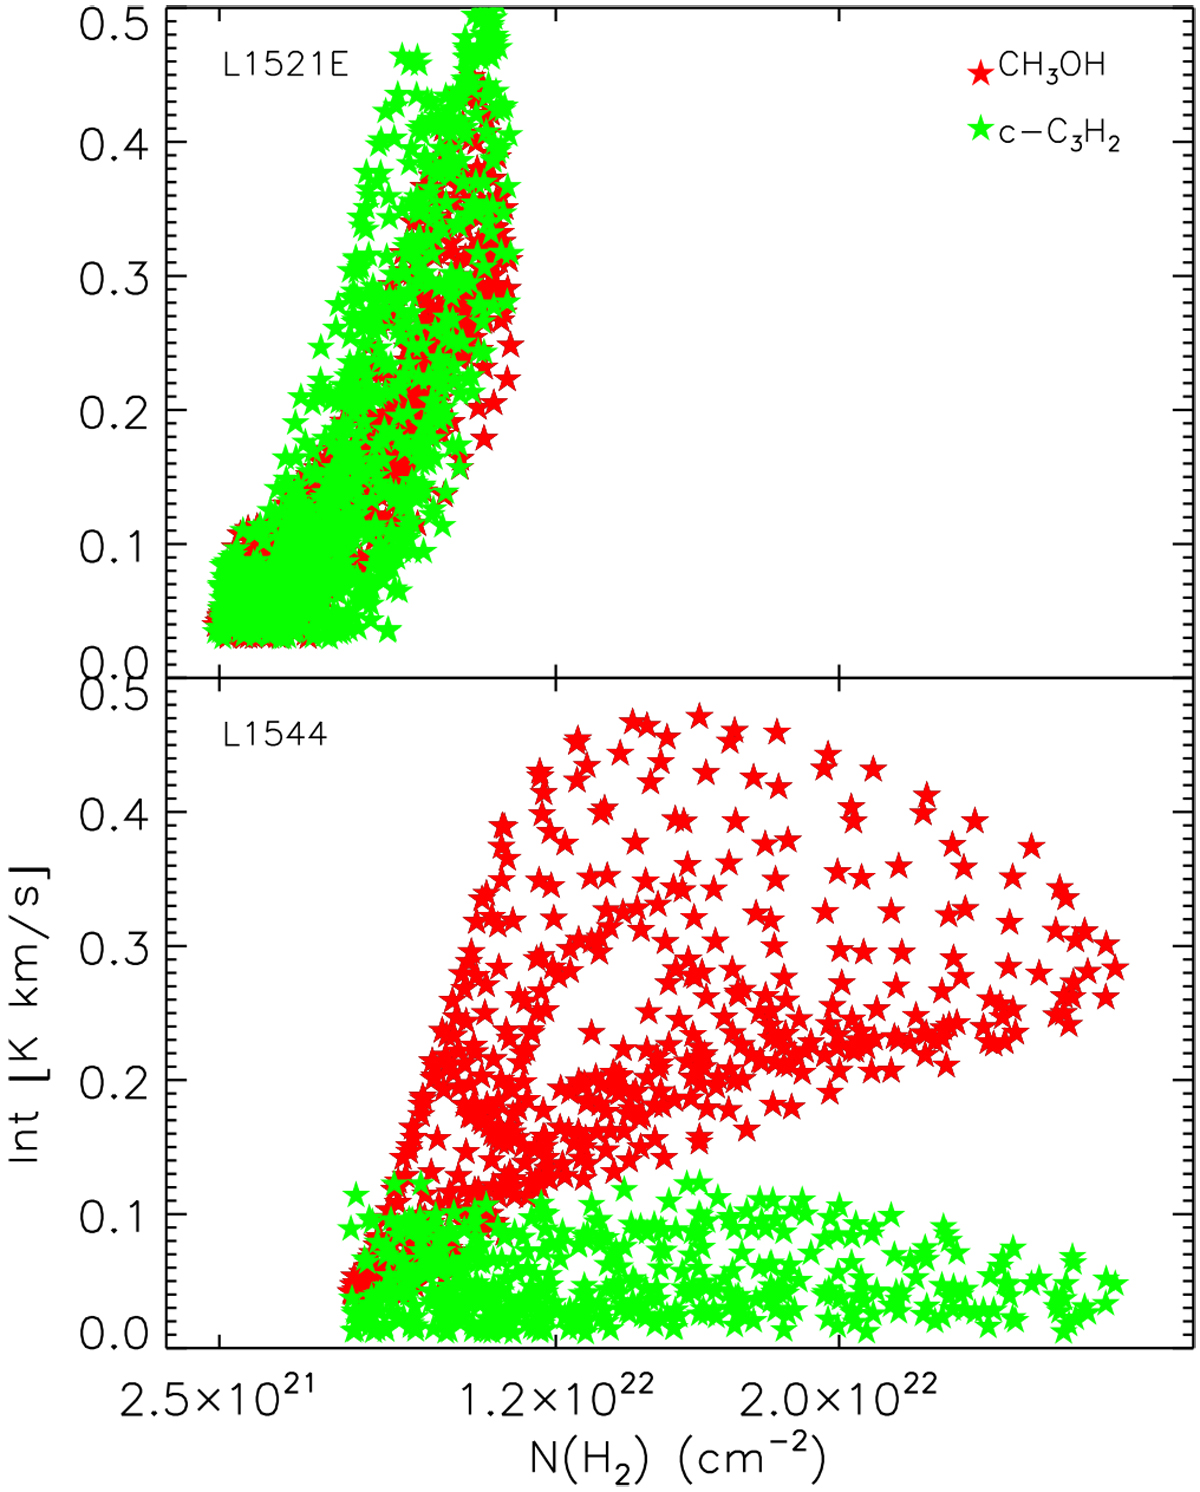
Integrated intensities of c-C3H2 (green symbols) and CH3OH (red symbols) as function of H2 column densities toward L1521E and L1544. The data plotted for L1544 are from (Spezzano et al. 2016).
Current usage metrics show cumulative count of Article Views (full-text article views including HTML views, PDF and ePub downloads, according to the available data) and Abstracts Views on Vision4Press platform.
Data correspond to usage on the plateform after 2015. The current usage metrics is available 48-96 hours after online publication and is updated daily on week days.
Initial download of the metrics may take a while.