Open Access
Fig. 11
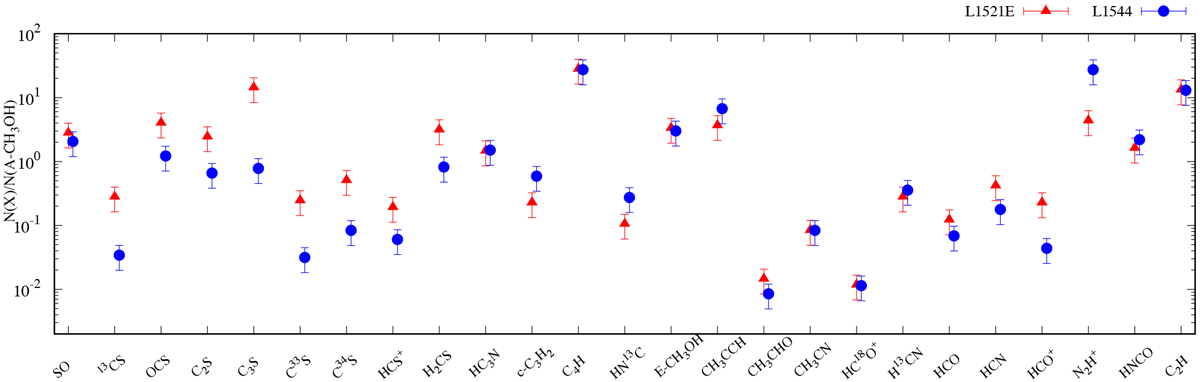
Comparison of relative abundances of species observed toward dust peak of both L1521E and L1544. As explained in Sect. 4.1, the abundances were derived using the column densities for an excitation temperature of 4.5 K for L1521E and 5 K forL1544.
Current usage metrics show cumulative count of Article Views (full-text article views including HTML views, PDF and ePub downloads, according to the available data) and Abstracts Views on Vision4Press platform.
Data correspond to usage on the plateform after 2015. The current usage metrics is available 48-96 hours after online publication and is updated daily on week days.
Initial download of the metrics may take a while.