Fig. 9
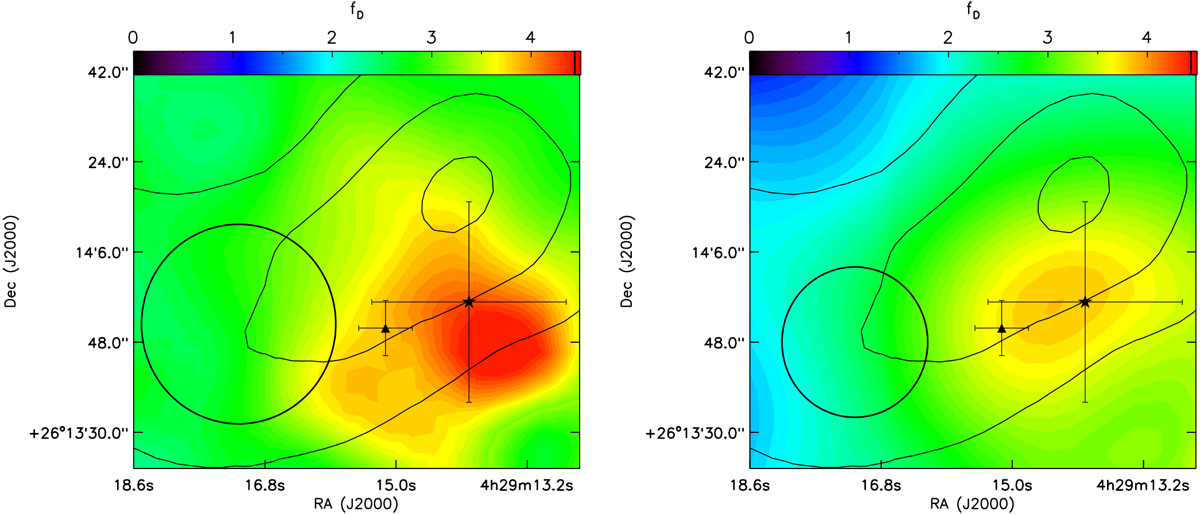
Map of CO depletion factors toward L1521E. These were calculated using H2 column densities based on the Herschel/SPIRE data with β = 1.5 (left panel) and based on the 1.2 mm map (right panel), the derived C17O abundances, and a reference value of X(C17O) = 5.4 × 10⁻⁸. The contours show the spatial distribution of methanol and start from 6σ rms noise level in steps of 6σ rms. The triangle shows the peak of the 1.2 mm emission and the asterisk symbol shows the Herschel dust peak. The depletion factor toward the Herschel dust peak is about 4.3 based on the Herschel N(H2) values and about 3.9 based on the N(H2) values calculated from the 1.2 mm data. The black circles show the beam sizes that were used to calculate the depletion factors.
Current usage metrics show cumulative count of Article Views (full-text article views including HTML views, PDF and ePub downloads, according to the available data) and Abstracts Views on Vision4Press platform.
Data correspond to usage on the plateform after 2015. The current usage metrics is available 48-96 hours after online publication and is updated daily on week days.
Initial download of the metrics may take a while.