Fig. 1
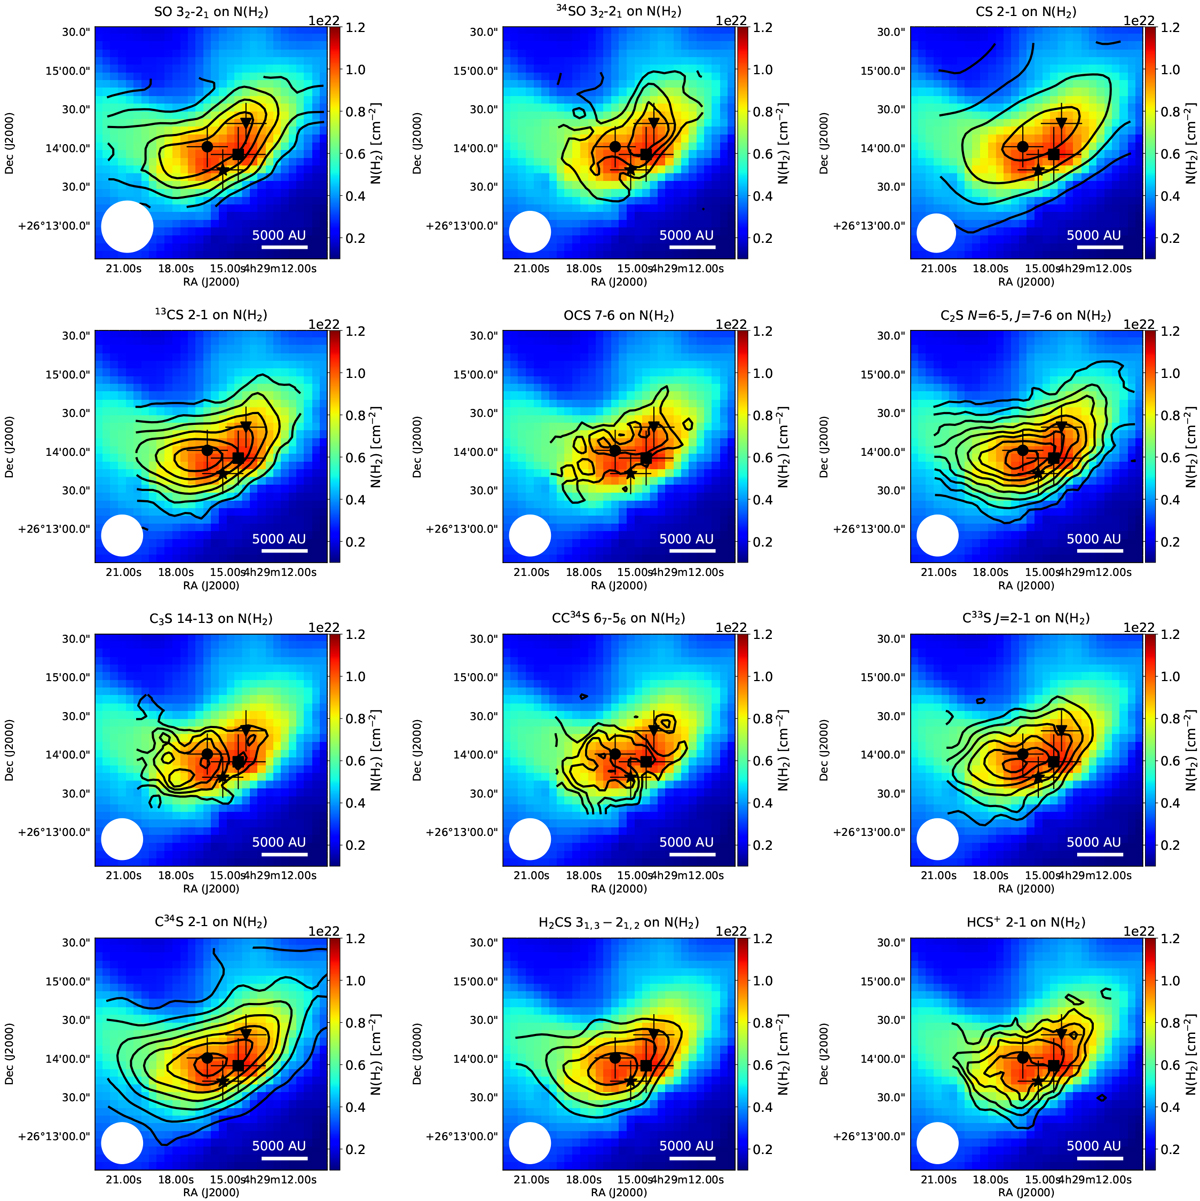
Spatial distributions of molecules detected toward L1521E (black contours) overplotted on N(H2) map (colors) derived from Herschel/SPIRE. The black dot, triangle, and asterisk show the c-C3H2, CH3OH, and HNCO peaks, respectively. The black square shows the Herschel dust peak. The beam size overplotted on the SO map shows the beam size of the SPIRE data, for the other maps it is the beam size of the IRAM-30 m data. For SO, CS, 13CS, C2S, and C34S the contour levels start from 3σ rms in steps of 3σ rms with 3σ rms values of 0.13, 0.38, 0.06, 0.12, and 0.11 K km s−1, respectively. For OCS and C33S the contour levels start from 6σ rms in steps of 4σ rms with 3σ rms levels of 0.02 K km s−1 for both species. For 34SO, C3S, CC34S, H2CS, and HCS+ the contour levels start from 9σ rms in steps of 6σ rms with 3σ rms values of 0.01, 0.02, 0.01, 0.07, and 0.03 K km s−1, respectively.
Current usage metrics show cumulative count of Article Views (full-text article views including HTML views, PDF and ePub downloads, according to the available data) and Abstracts Views on Vision4Press platform.
Data correspond to usage on the plateform after 2015. The current usage metrics is available 48-96 hours after online publication and is updated daily on week days.
Initial download of the metrics may take a while.