Fig. 9.
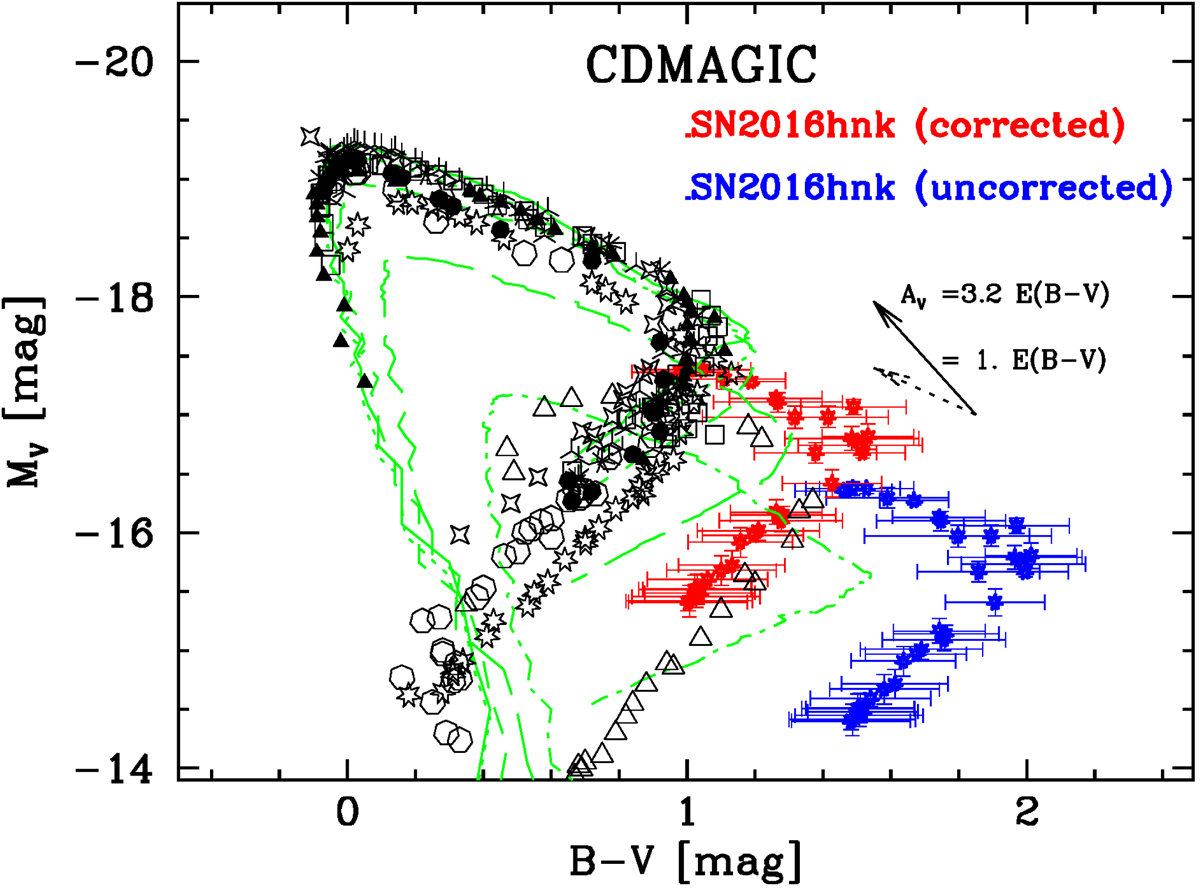
Representative panel for the CDMagic method, where a simultaneous fit in the B- and V-band light curves, the B vs. (B − V) and V vs. (B − V) diagrams, and the (B − V) evolution, is performed. More details are given in, for example, Fig. 13 in Höflich et al. (2017). We show the absolute V-band vs. (B − V) diagram populated with eight normal SNe Ia from the CSP-I (Krisciunas et al. 2017; SNe 2004ef, 2005eo, 2005el, 2005iq, 2005ki, 2005M, 2006bh, 2006D; in differnet symbols), the SN Ia 1991bg-like 2005ke (empty triangles), and the uncorrected (blue) and corrected (red) SN 2016hnk data points. Models from Höflich et al. (2017) are shown in green for reference; the two arrows are the reddening vectors representing the direction to which the data points are shifted when affected by RV = 3.2 and RV = 1.0. SN 2016hnk corrected data points lie on top of the other subluminous SN Ia 2005ke, and from the shift we estimate an RV = 2.1 ± 0.6.
Current usage metrics show cumulative count of Article Views (full-text article views including HTML views, PDF and ePub downloads, according to the available data) and Abstracts Views on Vision4Press platform.
Data correspond to usage on the plateform after 2015. The current usage metrics is available 48-96 hours after online publication and is updated daily on week days.
Initial download of the metrics may take a while.