Fig. 6.
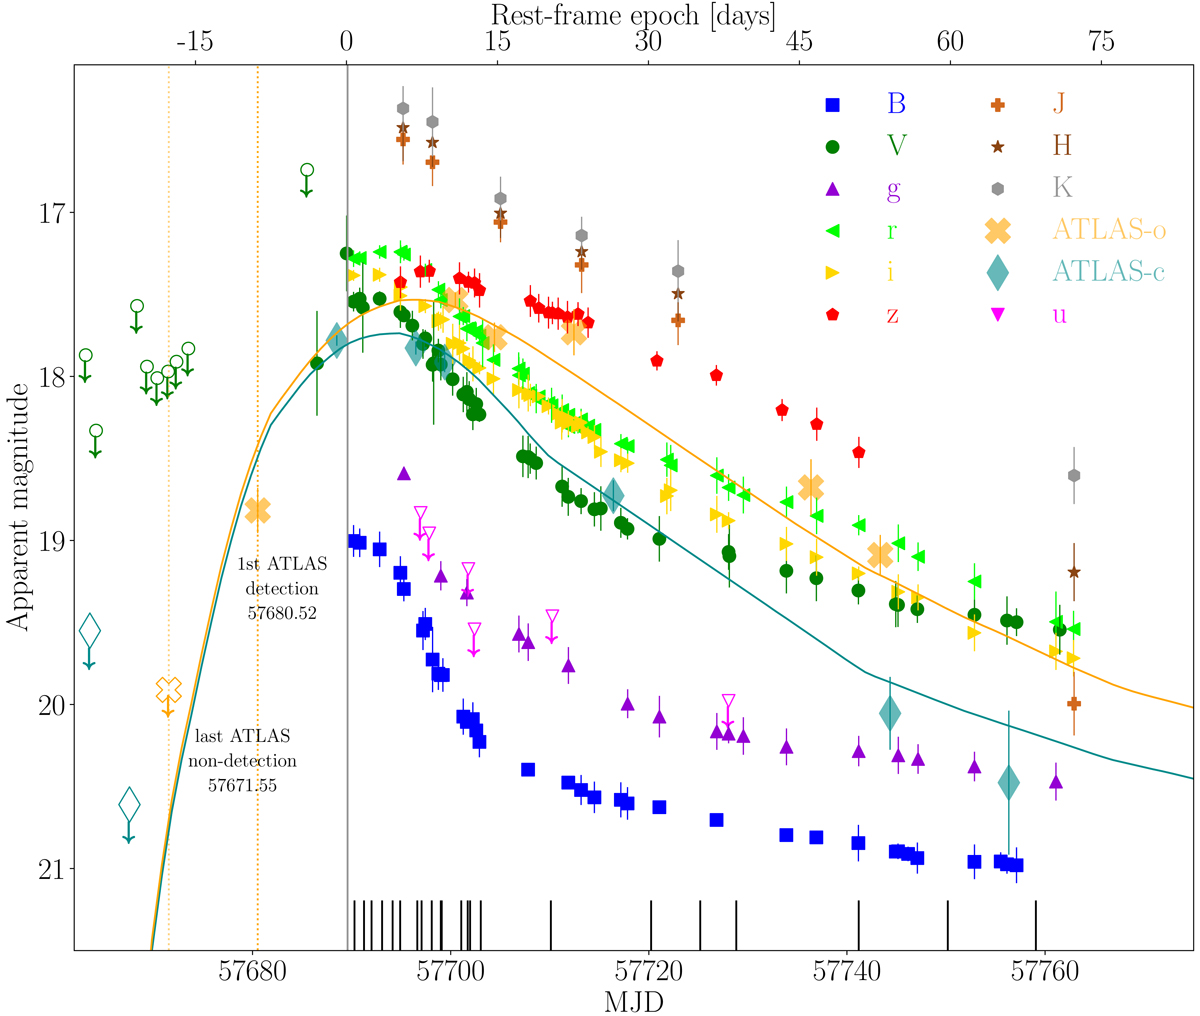
Optical and NIR light curves. A gray solid vertical line represents the epoch of peak brightness in the B band obtained from a SNOOPY fit to the cyan and orange ATLAS light curves, which are shown in orange and cyan solid lines. The ticks at the bottom represent epochs with optical spectra available. The dotted vertical lines delineate the last non-detection (yellow) and first detection (orange) epochs. The open symbols with downward arrows correspond to ASAS-SN (circles), ATLAS (crosses/diamonds), and u-band (triangles) non-detections.
Current usage metrics show cumulative count of Article Views (full-text article views including HTML views, PDF and ePub downloads, according to the available data) and Abstracts Views on Vision4Press platform.
Data correspond to usage on the plateform after 2015. The current usage metrics is available 48-96 hours after online publication and is updated daily on week days.
Initial download of the metrics may take a while.