Fig. 4.
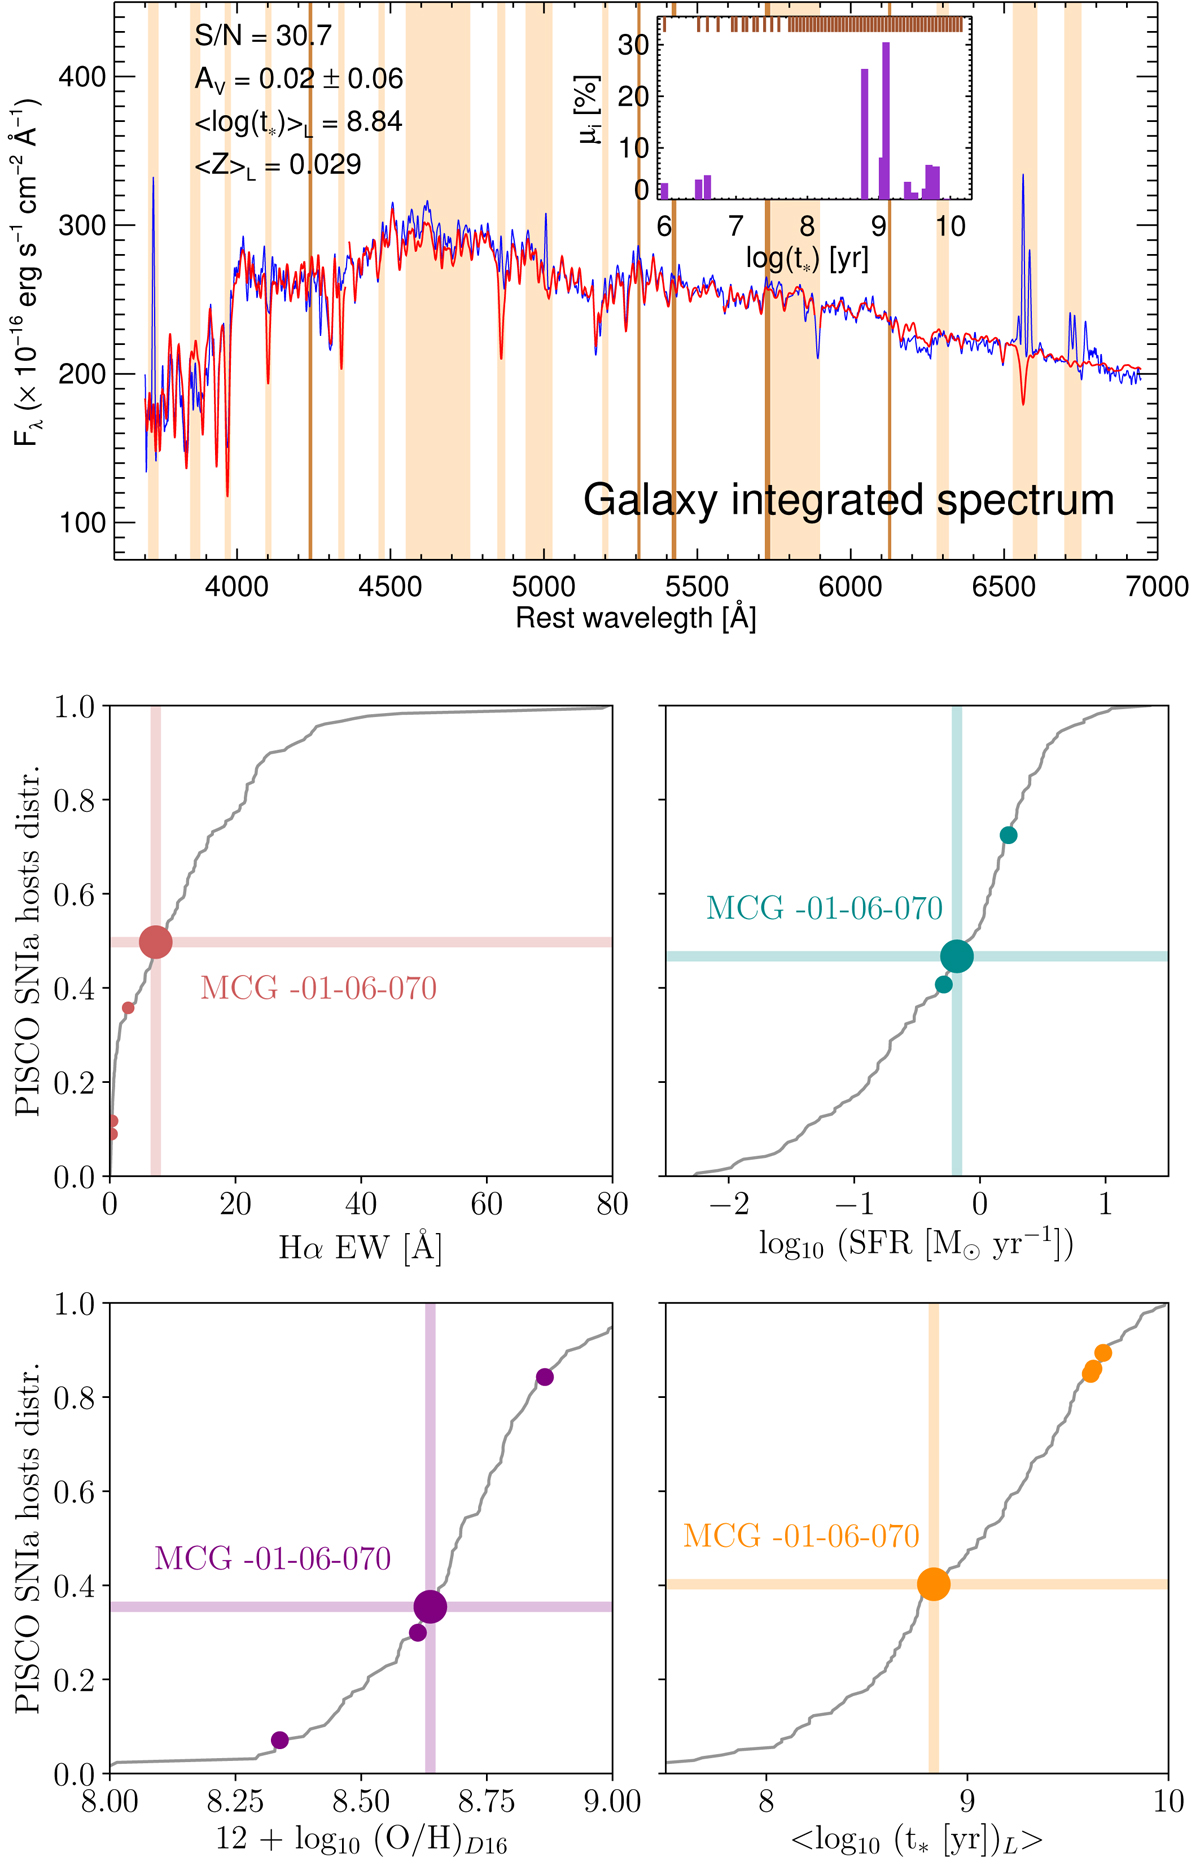
Top: MCG -01-06-070 integrated spectrum (blue) and best SSP fit from STARLIGHT (red). Vertical strips (in beige) represent masked regions in the fit due to known emission lines (such as Balmer lines, oxygen, and WR bumps) and regions with skylines (in brown). Inner panel: star formation history of the spectra (in purple), where brown ticks on top represent the ages of the models used in the fit. The S/N of the spectrum, optical extinction, average stellar age, and average metallicity are reported in the top left corners. Bottom rows: distributions of the Hα equivalent width, SFR, oxygen abundance, and average stellar age of all 180 SN Ia host galaxies in PISCO (Galbany et al. 2018). The large colored dots represent the position of MCG -01-06-070, and the three small dots represent other 1991bg-like SNIa hosts in PISCO.
Current usage metrics show cumulative count of Article Views (full-text article views including HTML views, PDF and ePub downloads, according to the available data) and Abstracts Views on Vision4Press platform.
Data correspond to usage on the plateform after 2015. The current usage metrics is available 48-96 hours after online publication and is updated daily on week days.
Initial download of the metrics may take a while.