Fig. A.5.
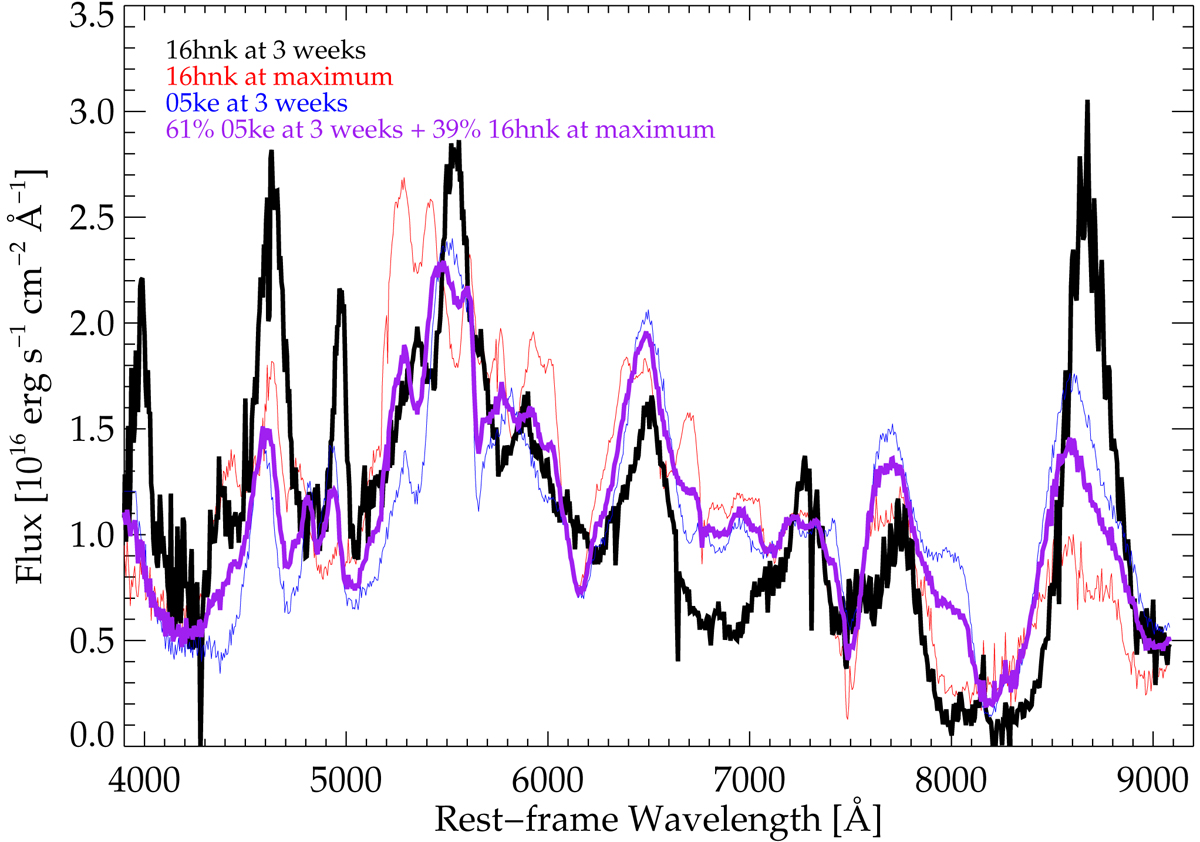
Simulation of a LE contaminated spectrum at three week past maximum, based on a fiducial subluminous spectrum at +3 weeks past maximum from SN 2005ke (contributing 61% to the total), and adding 39% of the SN 2016hnk spectrum at maximum light, which represents the contamination from the LE. Comparing this LE-affected spectrum (in purple) to the observed SN 2016hnk (in black) we do not see any feature that definitely confirms that the latter is affected by any feature reflected from earlier epochs.
Current usage metrics show cumulative count of Article Views (full-text article views including HTML views, PDF and ePub downloads, according to the available data) and Abstracts Views on Vision4Press platform.
Data correspond to usage on the plateform after 2015. The current usage metrics is available 48-96 hours after online publication and is updated daily on week days.
Initial download of the metrics may take a while.