Fig. 27.
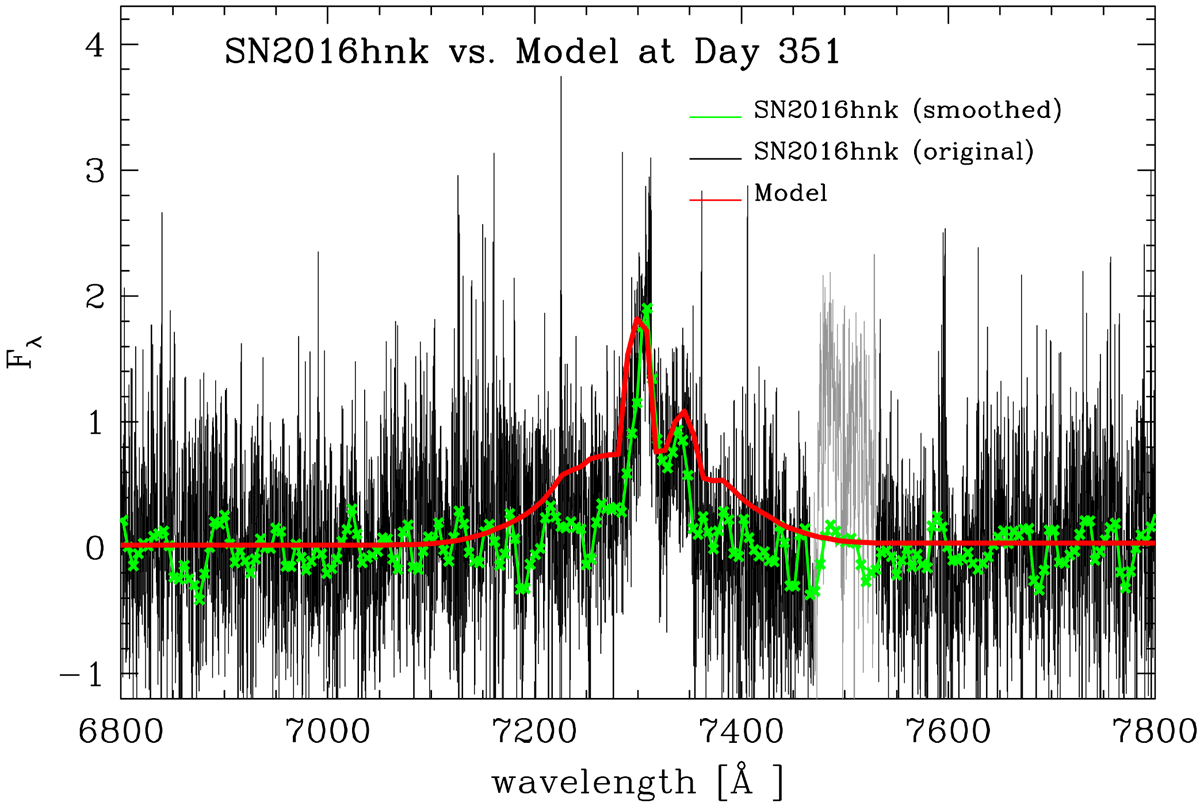
Comparison of the nebular spectrum of SN 2016hnk with our high-density delayed-detonation model in the rest frame assuming a redshift of z = 0.01610. The flux is in 10−18 erg s−1 cm−2 on the same scale as Fig. 19. The telluric region in the original spectrum is plotted in gray, around 7500 Å. The theoretical spectrum is dominated by a narrow, forbidden [Ca II] doublet at 7291 and 7324 Å above a quasi-continuum at about the 3% level formed by many transitions of mostly heavier elements including Fe, Co, Ni, and Cr.
Current usage metrics show cumulative count of Article Views (full-text article views including HTML views, PDF and ePub downloads, according to the available data) and Abstracts Views on Vision4Press platform.
Data correspond to usage on the plateform after 2015. The current usage metrics is available 48-96 hours after online publication and is updated daily on week days.
Initial download of the metrics may take a while.