Fig. 25.
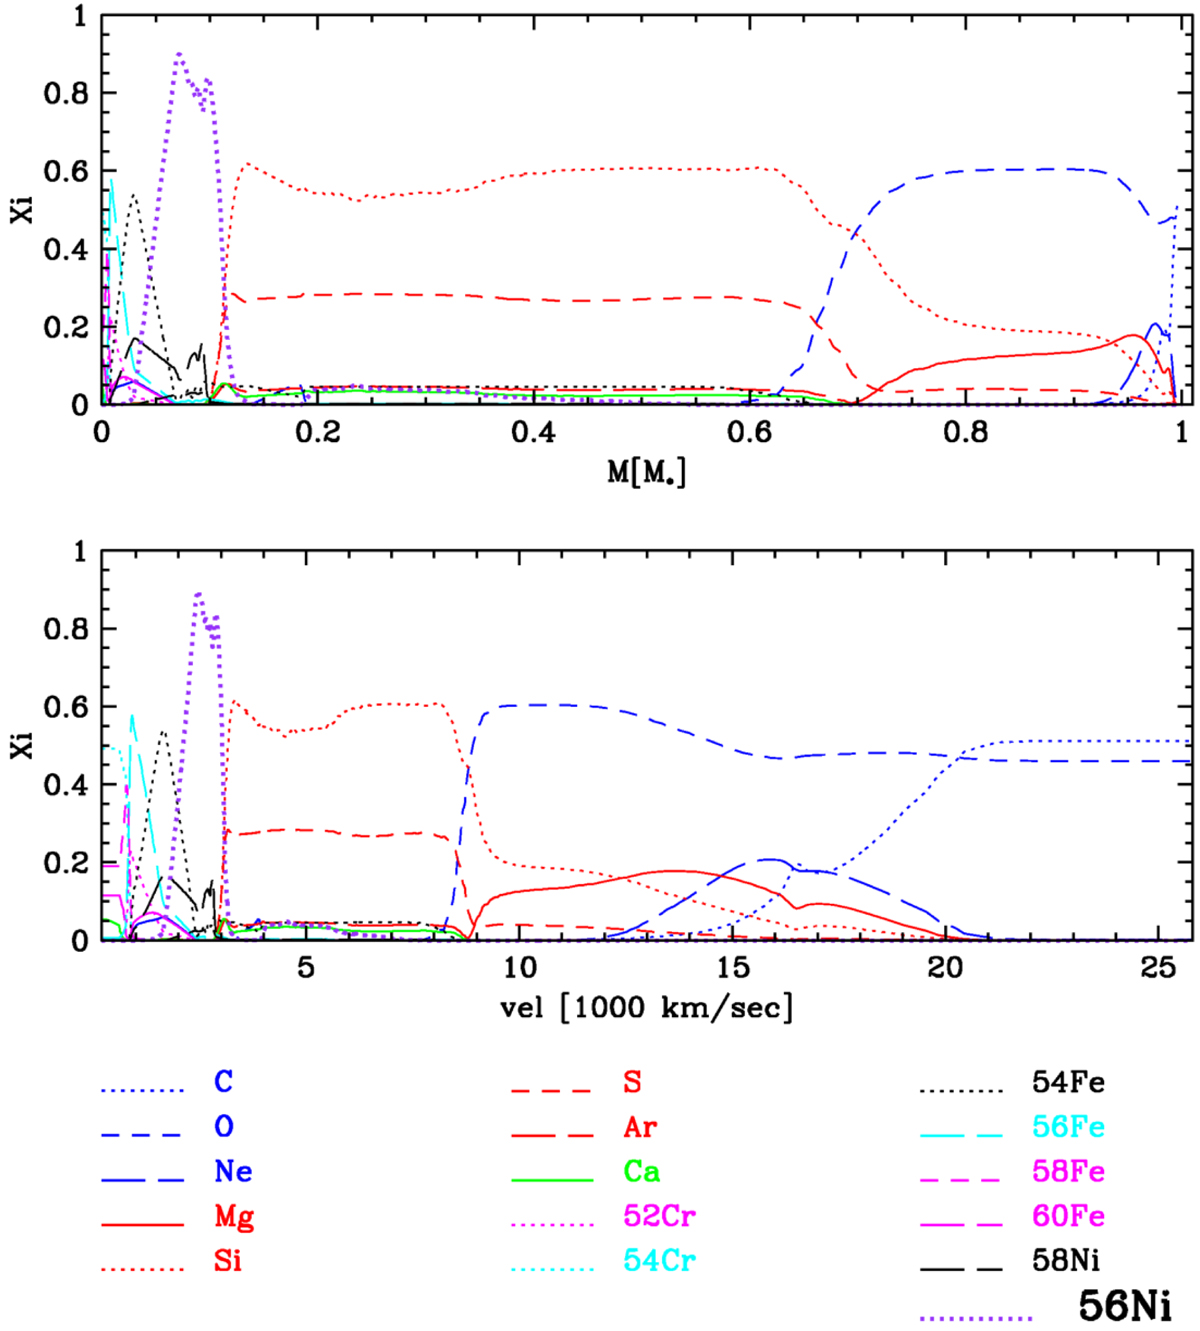
Same as Fig. 24 but showing the overall abundance structure at large times as a function of mass coordinate (top) and expansion velocity (bottom). It is very similar to the subluminous model for SN 1999by and consistent with the chemical structure based on our abundance tomography given in Table 3. In addition, we show the initial 56Ni → 56Co → 56Fe at the time of the explosion (purple dotted line).
Current usage metrics show cumulative count of Article Views (full-text article views including HTML views, PDF and ePub downloads, according to the available data) and Abstracts Views on Vision4Press platform.
Data correspond to usage on the plateform after 2015. The current usage metrics is available 48-96 hours after online publication and is updated daily on week days.
Initial download of the metrics may take a while.