Fig. 21.
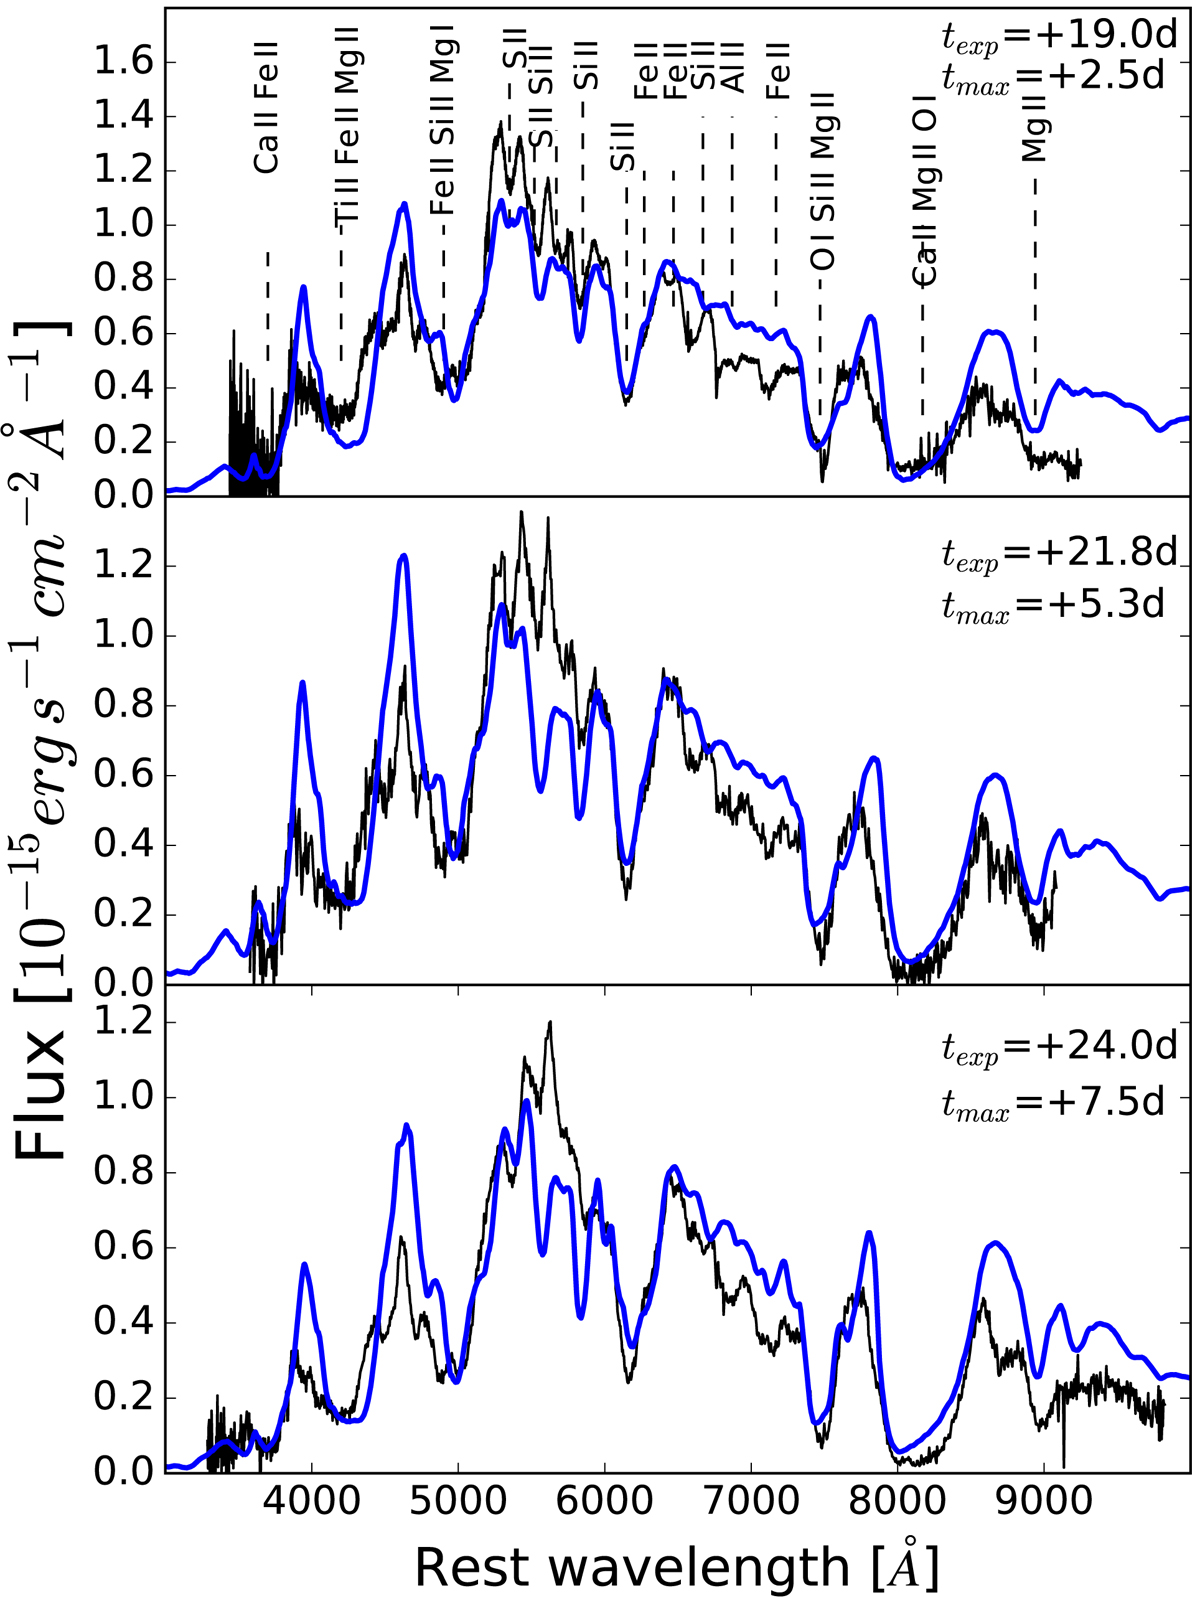
Time series of data (black) and spectral models (blue) for SN 2016hnk during the photospheric phase. The data were corrected for foreground and host galaxy extinction. The observer-frame time from B-band maximum and the rest-frame time from explosion is provided for each model. Line identifications from the model are shown in the top plot.
Current usage metrics show cumulative count of Article Views (full-text article views including HTML views, PDF and ePub downloads, according to the available data) and Abstracts Views on Vision4Press platform.
Data correspond to usage on the plateform after 2015. The current usage metrics is available 48-96 hours after online publication and is updated daily on week days.
Initial download of the metrics may take a while.