Fig. 20.
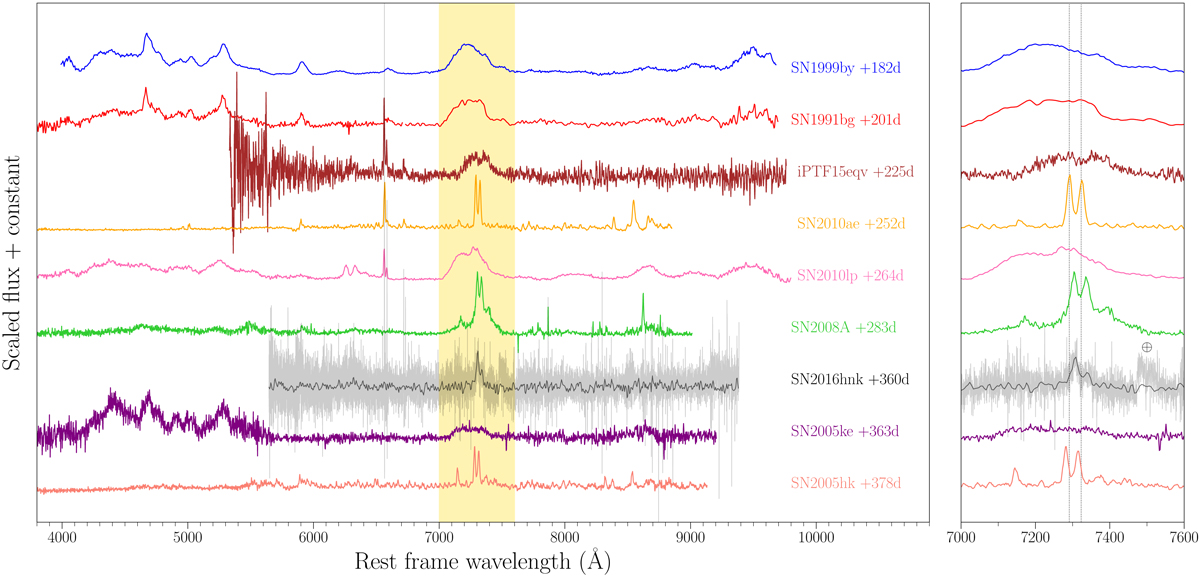
Comparison of SN 2016hnk nebular spectra (in black) to other 1991bg-like, 2002es-like, 2002cx-like, and Ca-rich objects. While all these objects show Ca emission at late times, only SN 2002cx-like (and possibly 2002es-like; e.g., SN 2010lp) objects show the narrow emission lines similar to SN 2016hnk. The yellow shaded region is zoomed in on the right panel, where the vertical dotted lines represent the rest-frame wavelength of the two [Ca II] emission lines. We note that while SN 2005hk lines have negative velocities, SN 2008A lines have positive velocities similar to SN 2016hnk.
Current usage metrics show cumulative count of Article Views (full-text article views including HTML views, PDF and ePub downloads, according to the available data) and Abstracts Views on Vision4Press platform.
Data correspond to usage on the plateform after 2015. The current usage metrics is available 48-96 hours after online publication and is updated daily on week days.
Initial download of the metrics may take a while.