Fig. 19.
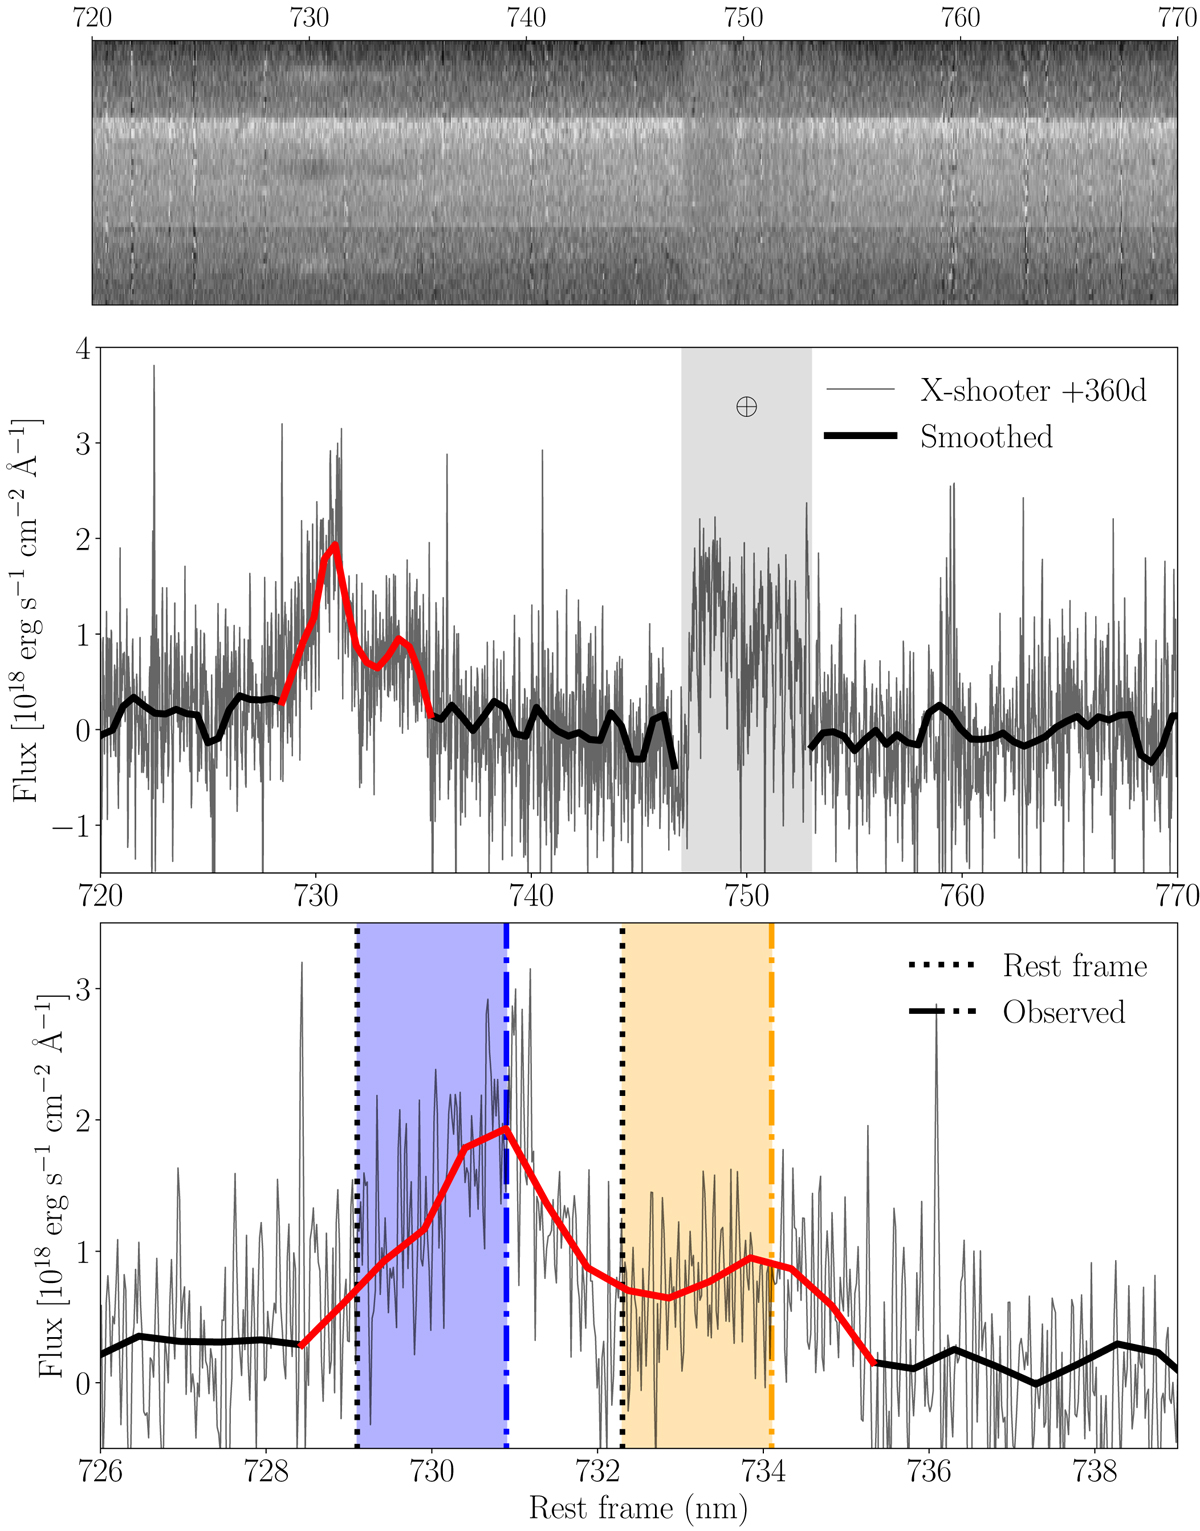
Top: two-dimensional frame of the combined X-shooter nebular phase (+360 d) spectrum of SN 2016hnk after sky subtraction around the region where we detected the only feature. The trace can be clearly seen around 730 nm. The other feature around 750 nm is due to a bad telluric subtraction, since it is present along the spatial direction (vertical). Middle: combined 1D X-shooter optical spectrum showing the only two features detected in the whole UV+Opt+NIR wavelength range. Bottom: zoom-in to the feature we identified as being due to calcium emission. The blue and orange shaded regions represent the shift of ∼700 km s−1 between the peak of the emission and the rest-frame wavelength.
Current usage metrics show cumulative count of Article Views (full-text article views including HTML views, PDF and ePub downloads, according to the available data) and Abstracts Views on Vision4Press platform.
Data correspond to usage on the plateform after 2015. The current usage metrics is available 48-96 hours after online publication and is updated daily on week days.
Initial download of the metrics may take a while.