Fig. 18.
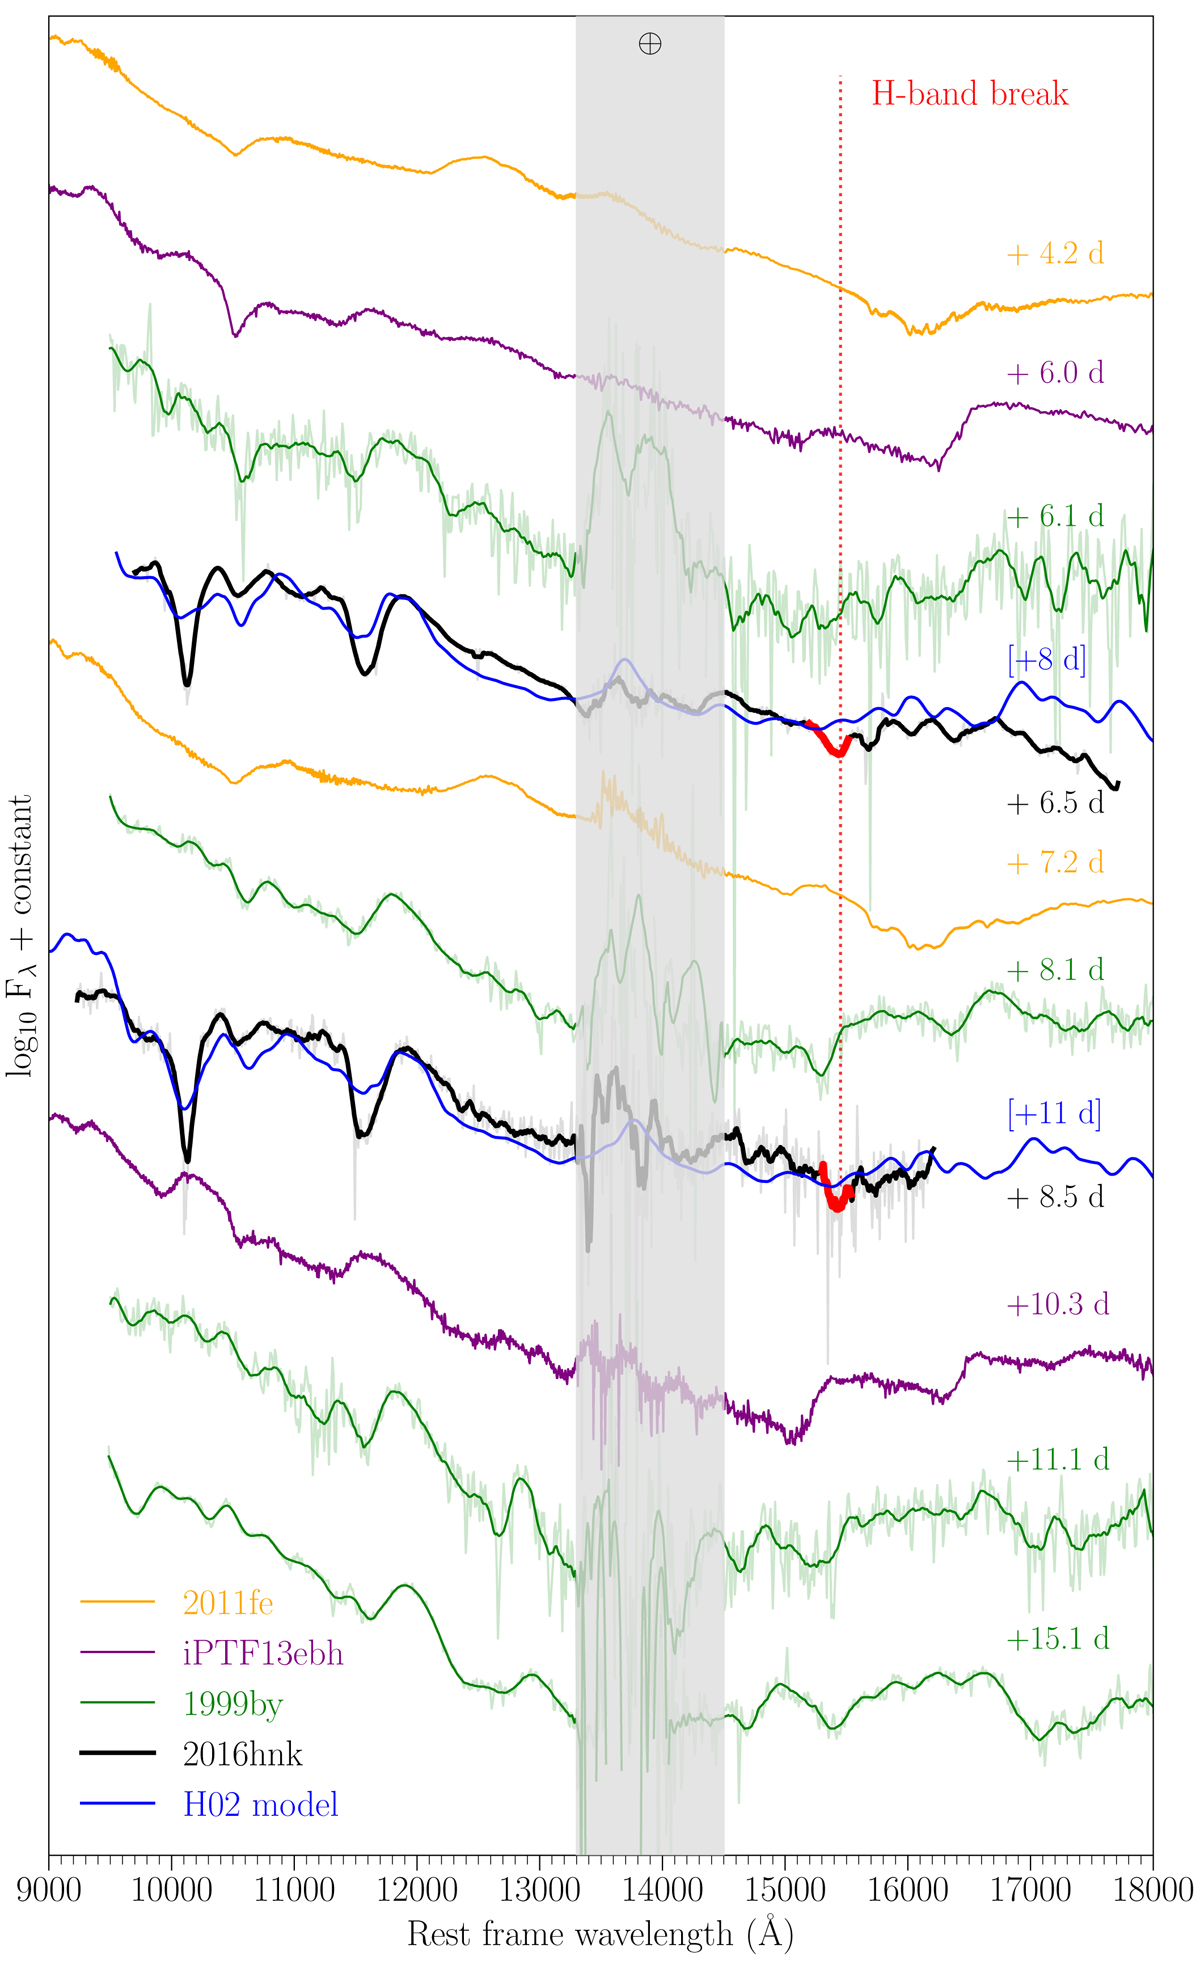
Near-infrared spectra of SN 2016hnk at around 6.1 and 8.5 (±3.1) days and, as a comparison, spectra of SN 2011fe (normal SN Ia), iPTF13ebh (transitional SN Ia), and SN 1999by (SN Ia 1991bg-like). We also include delayed-detonation models for SN 1999by some 24−27 days after the explosion, which corresponds to about 8−11 days past-maximum light in the B band (see Sect. 6.2 for more details). The SN 2016hnk spectra are dominated in the J band by blends of singly-ionized iron group elements, Ca II, and Si II, while the H band appears very flat with the H-band break indicated in red. The two deep features at around 10 000 and 11 500 Å are only seen shallower in SN 1999by spectra.
Current usage metrics show cumulative count of Article Views (full-text article views including HTML views, PDF and ePub downloads, according to the available data) and Abstracts Views on Vision4Press platform.
Data correspond to usage on the plateform after 2015. The current usage metrics is available 48-96 hours after online publication and is updated daily on week days.
Initial download of the metrics may take a while.