Fig. 17.
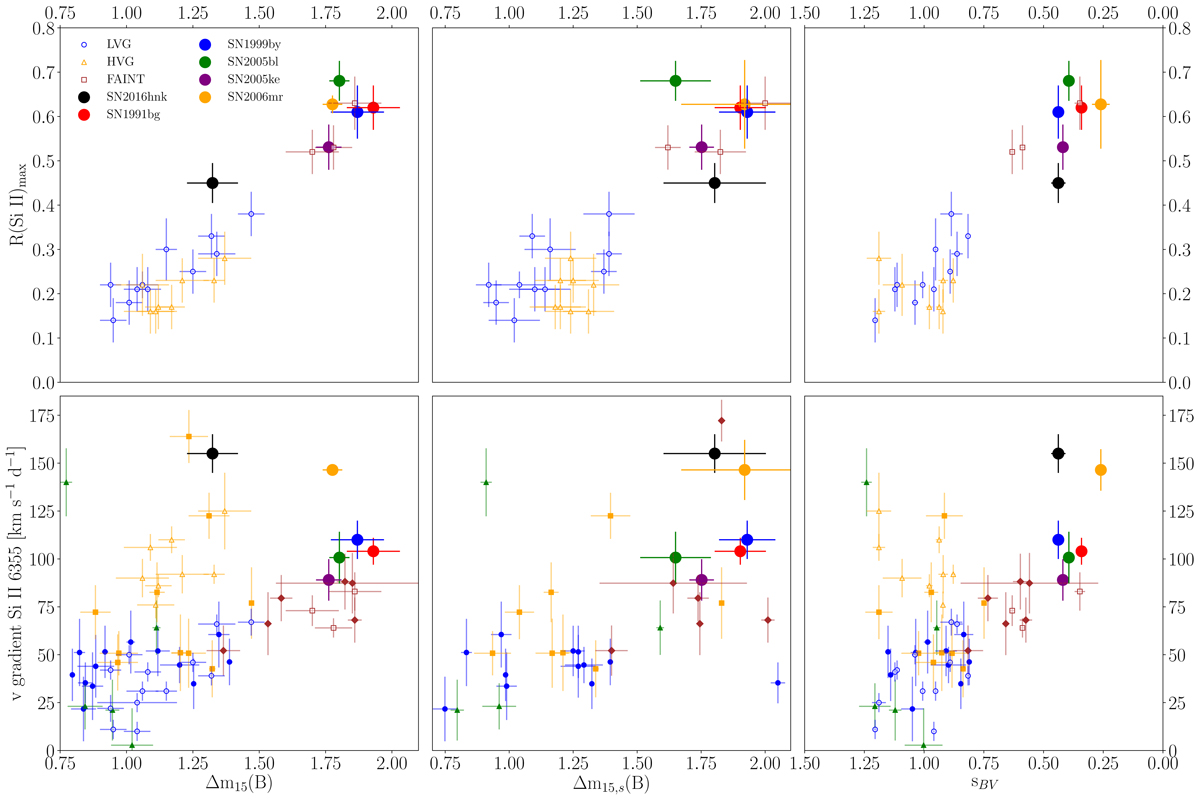
Benetti et al. (2005) diagrams of R(Si II) and Si II velocity gradient as a function of Δm15 (left column). We replicated these diagrams using Δm15, s (center) and sBV (right column) instead as a SN light curve width parameter. In all panels, open symbols represent measurements from the original SN sample in Benetti et al. (2005), while filled symbols are measurements from the CSP-I (Folatelli et al. 2013).
Current usage metrics show cumulative count of Article Views (full-text article views including HTML views, PDF and ePub downloads, according to the available data) and Abstracts Views on Vision4Press platform.
Data correspond to usage on the plateform after 2015. The current usage metrics is available 48-96 hours after online publication and is updated daily on week days.
Initial download of the metrics may take a while.