Fig. 16.
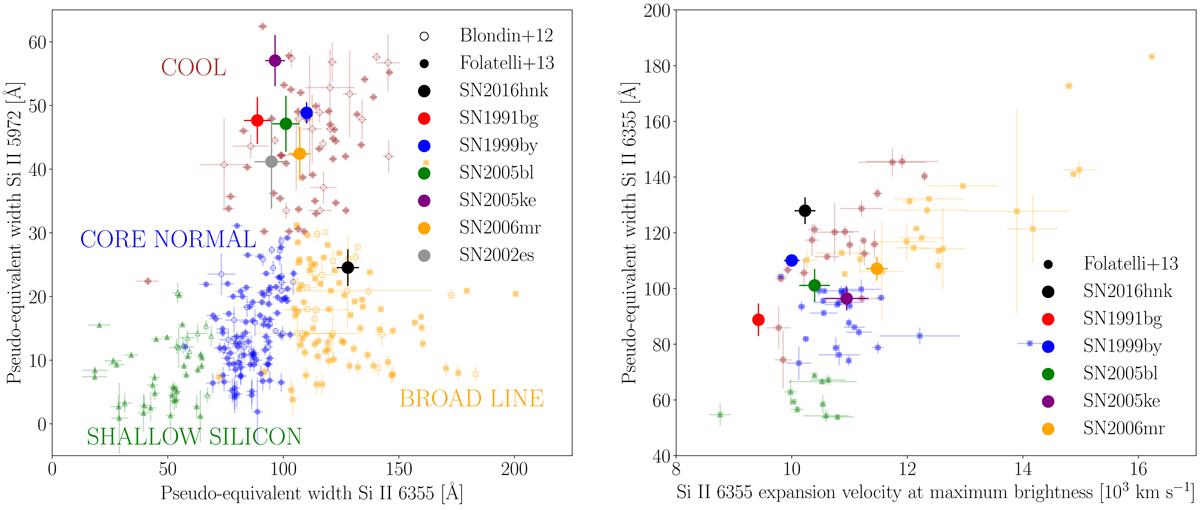
Branch et al. (2006) and Wang et al. (2009) diagrams. The left panel is populated with measurements from the CfA sample by Blondin et al. (2012) (open symbols) and from the CSP-I sample by Folatelli et al. (2013) (filled symbols). Right panel: only the measurements from Folatelli et al. (2013) are included. In both panels we added our own measurements of SN 2016hnk and the sample of subluminous 1991bg-like SNe Ia. SN 2002es was added only in the left panel because with a velocity of ∼5800 km s−1 it falls outside the range shown in the right panel.
Current usage metrics show cumulative count of Article Views (full-text article views including HTML views, PDF and ePub downloads, according to the available data) and Abstracts Views on Vision4Press platform.
Data correspond to usage on the plateform after 2015. The current usage metrics is available 48-96 hours after online publication and is updated daily on week days.
Initial download of the metrics may take a while.