Fig. 12.
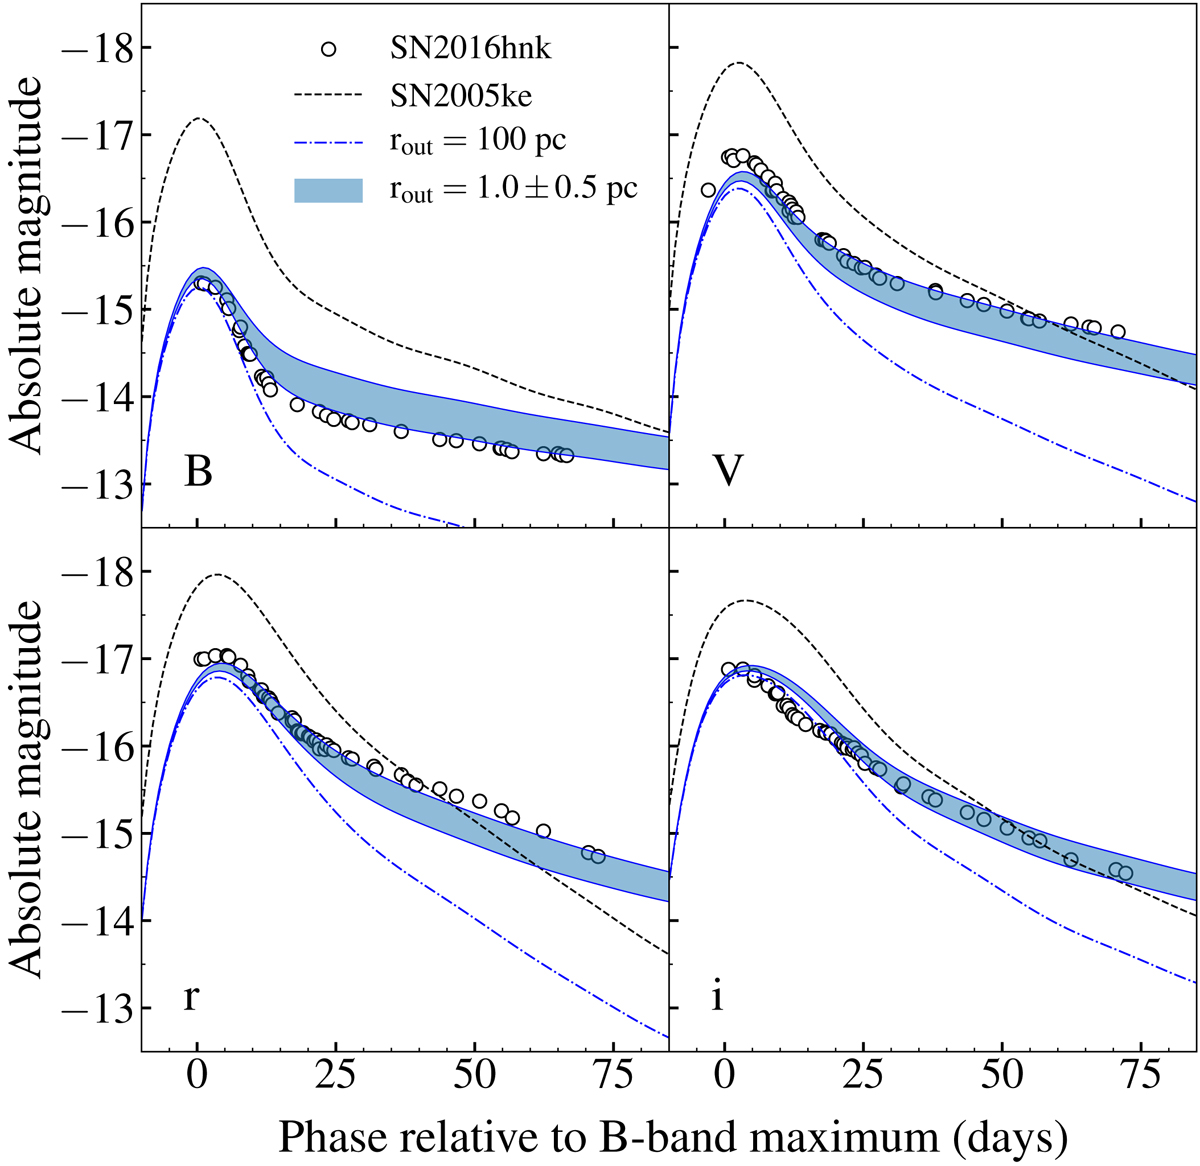
BVri observed light curves (in circles), compared with the multi-scattering dust model of Bulla et al. (2018b) using 1991bg-like SN 2005ke as a reference (black dotted line). Simulated light curves affected by nearby dust with E(B − V) = 0.5 mag at a distance of 1.0 ± 0.5 pc from the SN (blue filled strip) provide very reasonable fits to the observations, while a model in which dust is located at larger distance (100 pc; blue dashed line) just dims the light curves by keeping the same shape.
Current usage metrics show cumulative count of Article Views (full-text article views including HTML views, PDF and ePub downloads, according to the available data) and Abstracts Views on Vision4Press platform.
Data correspond to usage on the plateform after 2015. The current usage metrics is available 48-96 hours after online publication and is updated daily on week days.
Initial download of the metrics may take a while.