Fig. 11.
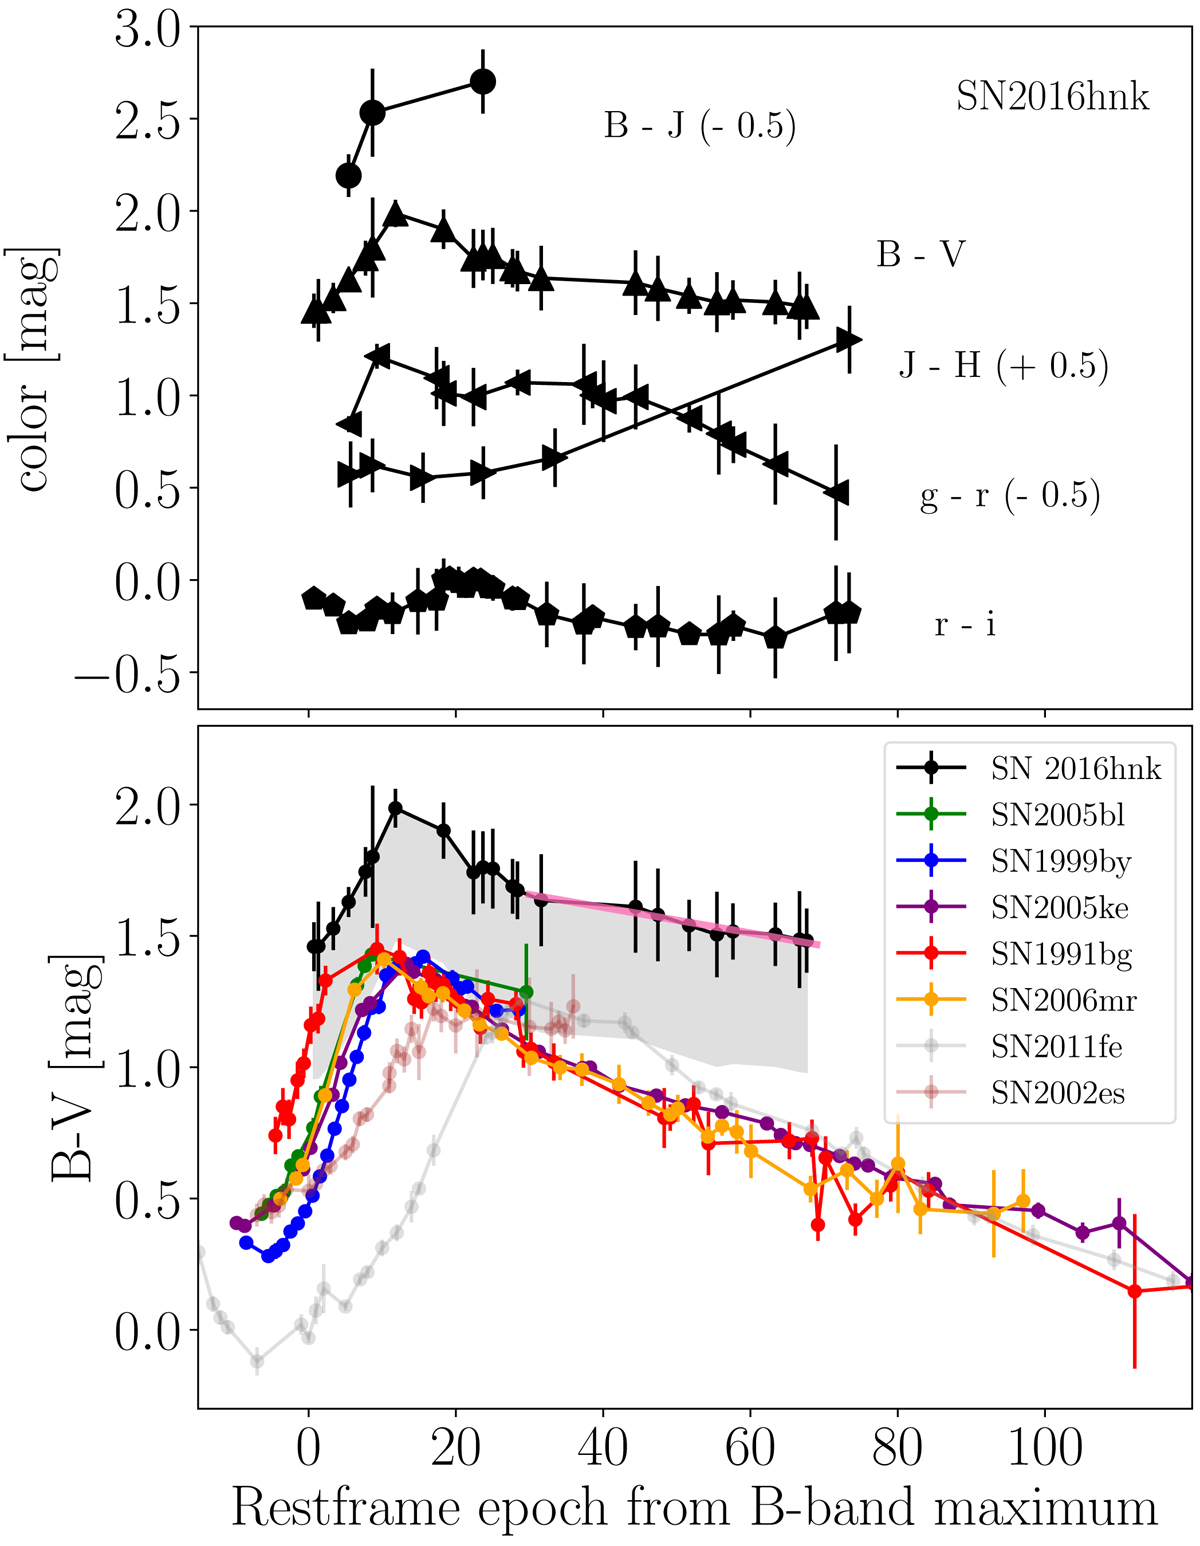
SN 2016hnk color curves (top panel), the B − V color curve of SN 2016hnk, the 1991bg-like comparison sample, and SNe 2002es and 2011fe for reference. The shaded region projects the SN 2016hnk color curve down by 0.5 mag, on top of the bulk of other 1991bg-like SNe Ia. In pink we show the linear fit the to B − V curve from 30 to 70 days past B-band maximum.
Current usage metrics show cumulative count of Article Views (full-text article views including HTML views, PDF and ePub downloads, according to the available data) and Abstracts Views on Vision4Press platform.
Data correspond to usage on the plateform after 2015. The current usage metrics is available 48-96 hours after online publication and is updated daily on week days.
Initial download of the metrics may take a while.