Fig. 9
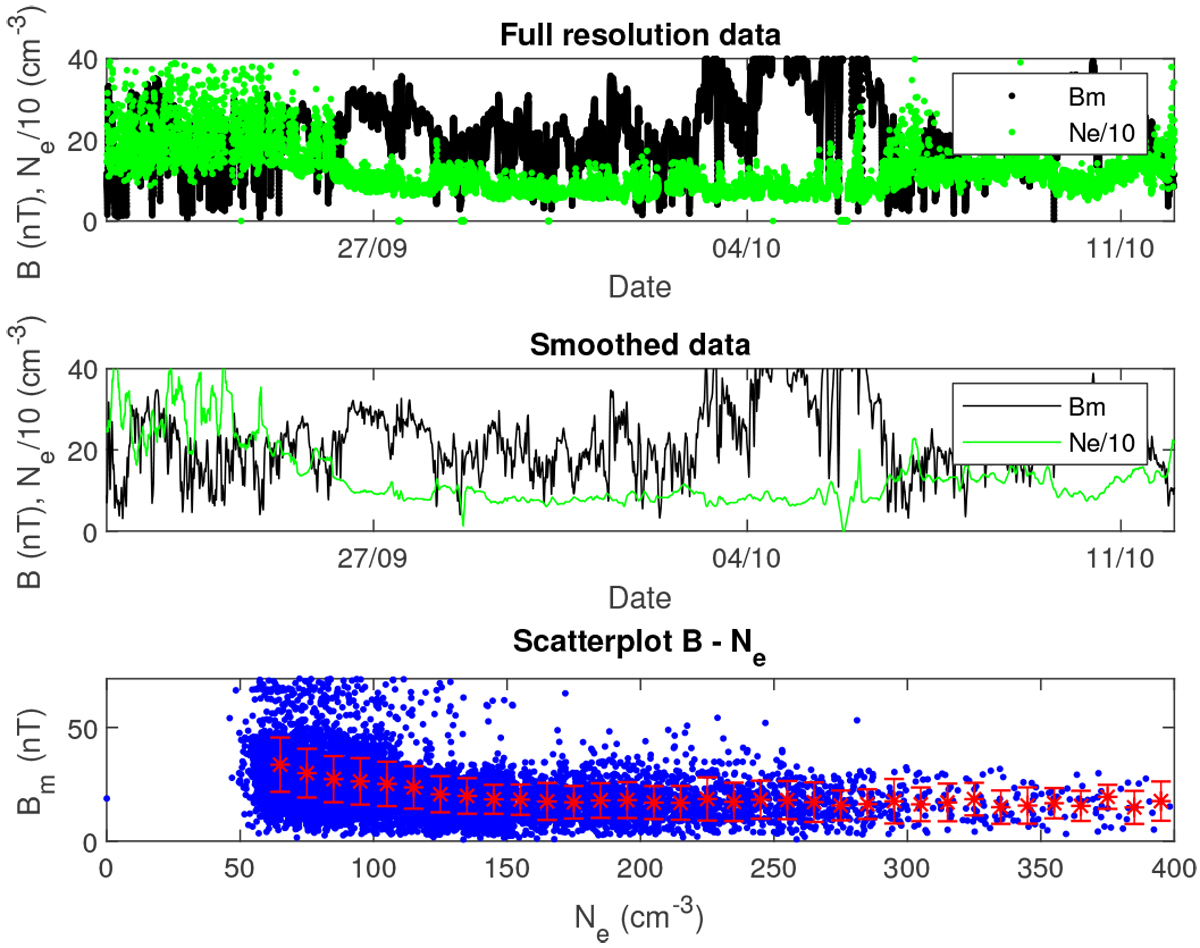
Top panel: downsampled magnetic field (black, to LAP-MIP resolution) and full-resolution LAP-MIP electron density (green, values divided by 10). Middle panel: smoothed data over 30 data points. A signature of an anticorrelation between B and Ne is discernable. Bottom panel: scatter plot of magnetic field strength vs. electron density. The red points show the mean of the magnetic field with error bars for consecutive intervals of Ne of 10 cm−3 width.
Current usage metrics show cumulative count of Article Views (full-text article views including HTML views, PDF and ePub downloads, according to the available data) and Abstracts Views on Vision4Press platform.
Data correspond to usage on the plateform after 2015. The current usage metrics is available 48-96 hours after online publication and is updated daily on week days.
Initial download of the metrics may take a while.