Fig. 4
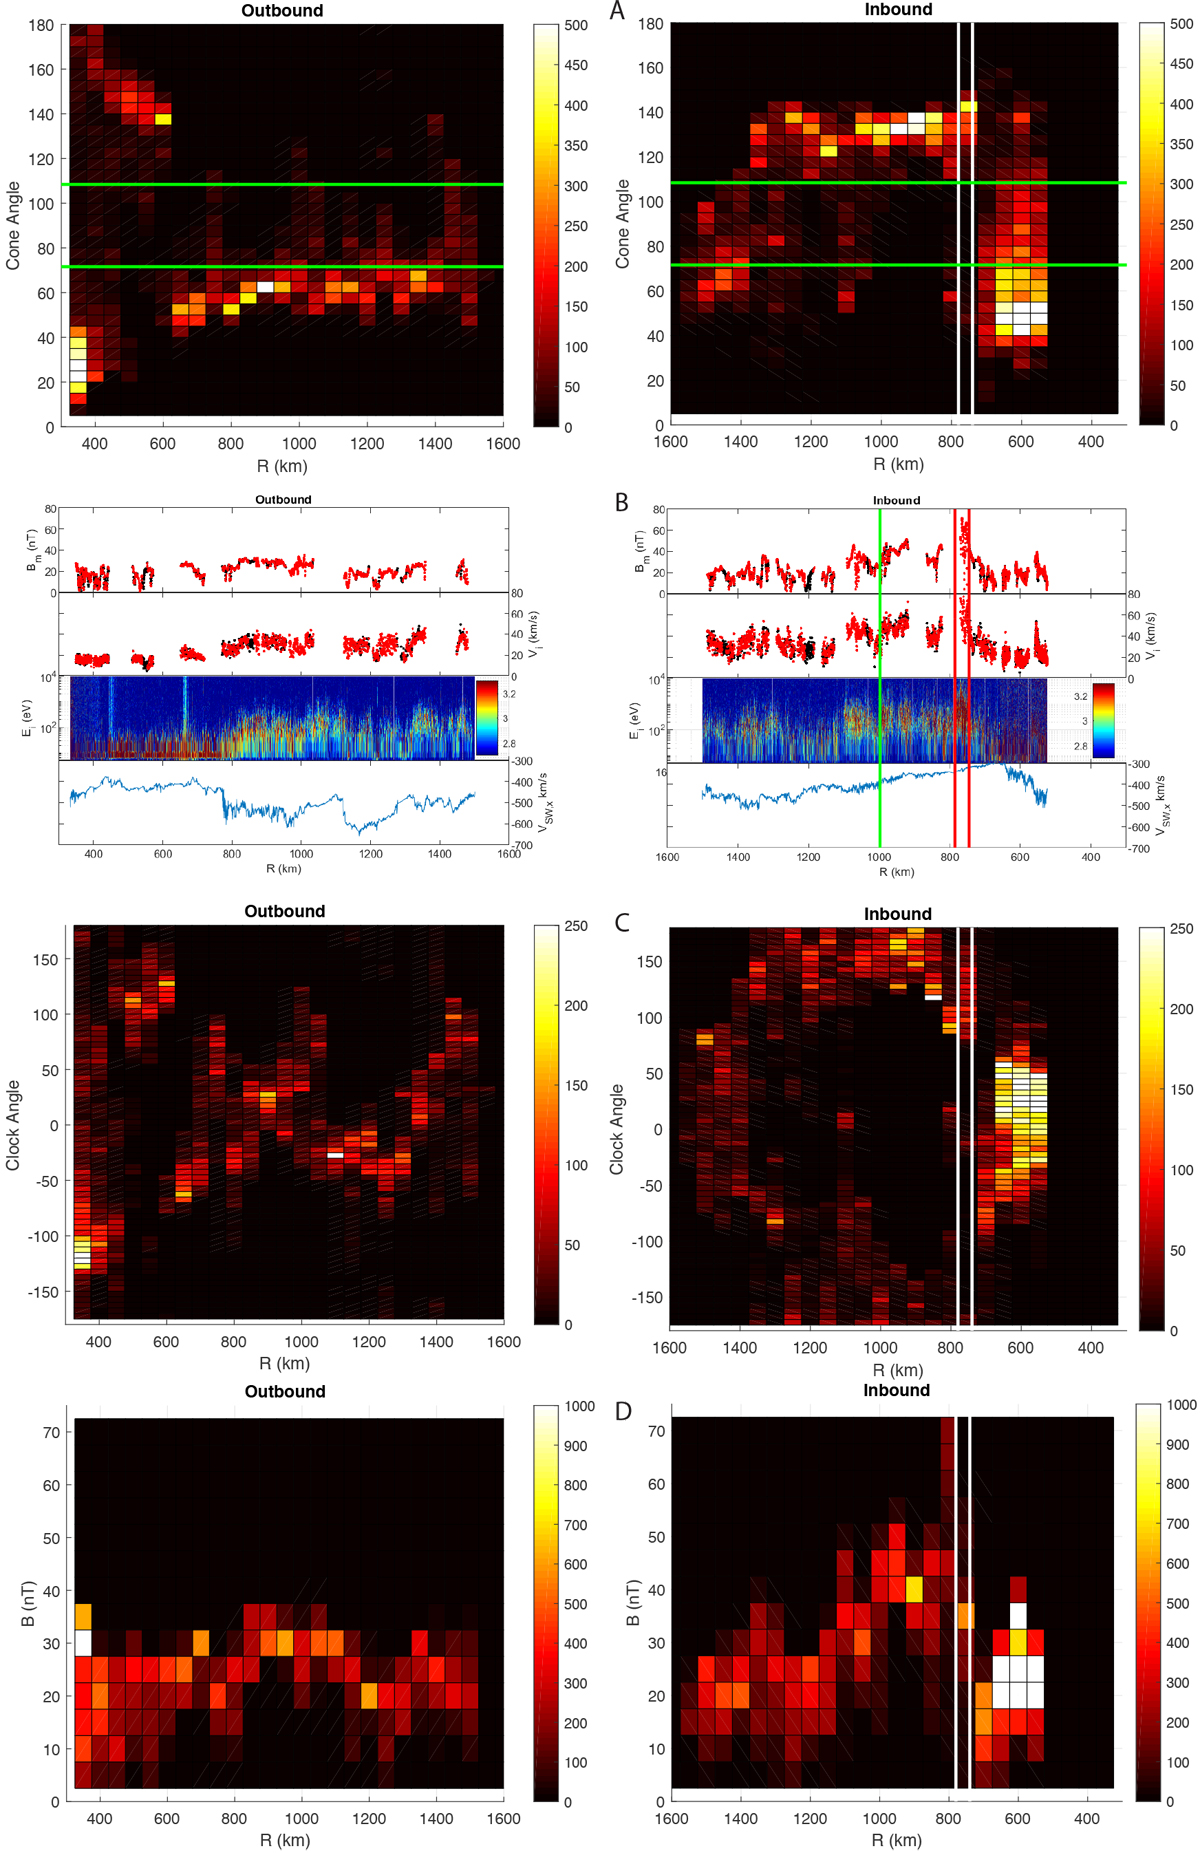
A: two-dimensional histograms of the cone angle of the magnetic field along the Rosetta orbit for the outbound (left) and inbound (right) leg. B: magnetic field, ICA ion velocity, IES ion energy-time spectrogram, and propagated solar wind. The magnetometer data are only shown when simultaneous ICA data are available. The red points are for simultaneous MAG-ICA-MIP data. C: two-dimensional histograms of the clock angle of the magnetic field along the Rosetta orbit. D: two-dimensional histograms of the magnetic field strength along the Rosetta orbit. The two vertical white (red) lines in the inbound column show where the interaction with the CME took place. Between the vertical green and red line is the interval where small CMEs may have interacted with the comet (see Edberg et al. 2016).
Current usage metrics show cumulative count of Article Views (full-text article views including HTML views, PDF and ePub downloads, according to the available data) and Abstracts Views on Vision4Press platform.
Data correspond to usage on the plateform after 2015. The current usage metrics is available 48-96 hours after online publication and is updated daily on week days.
Initial download of the metrics may take a while.