Fig. 8.
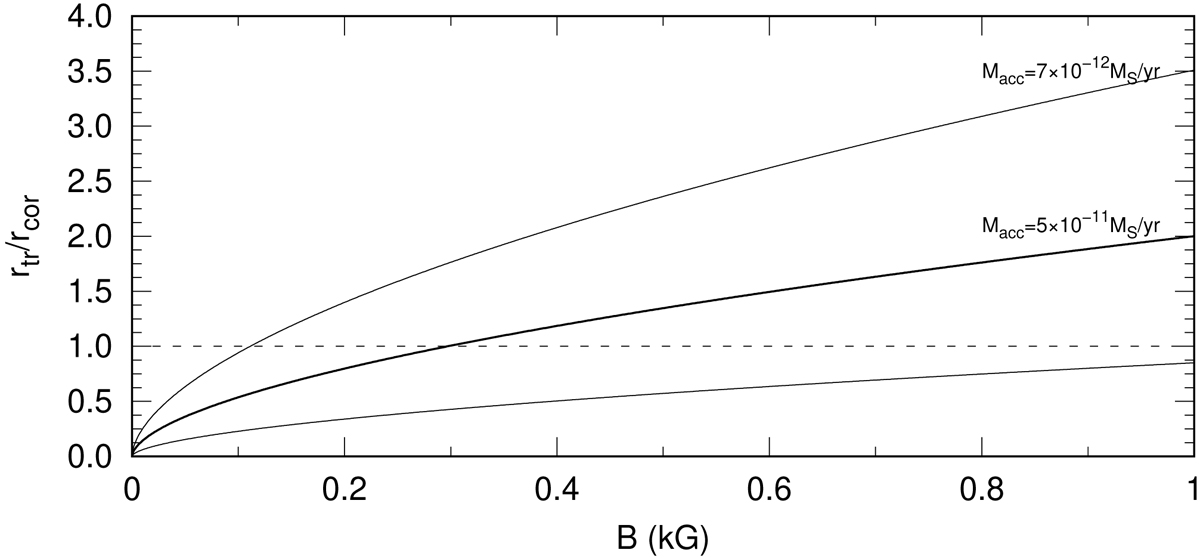
Dependence of rtr/rcor from the magnetic field strength in the case of RZ Psc. The dotted line indicates the border between the magnetospheric accretion (below) and magnetic propeller (above) regimes. The unlabeled curve was computed assuming a mass accretion rate of 10−9 M⊙ yr−1 and illustrates pure magnetospheric accretion.
Current usage metrics show cumulative count of Article Views (full-text article views including HTML views, PDF and ePub downloads, according to the available data) and Abstracts Views on Vision4Press platform.
Data correspond to usage on the plateform after 2015. The current usage metrics is available 48-96 hours after online publication and is updated daily on week days.
Initial download of the metrics may take a while.