Free Access
Fig. 4.
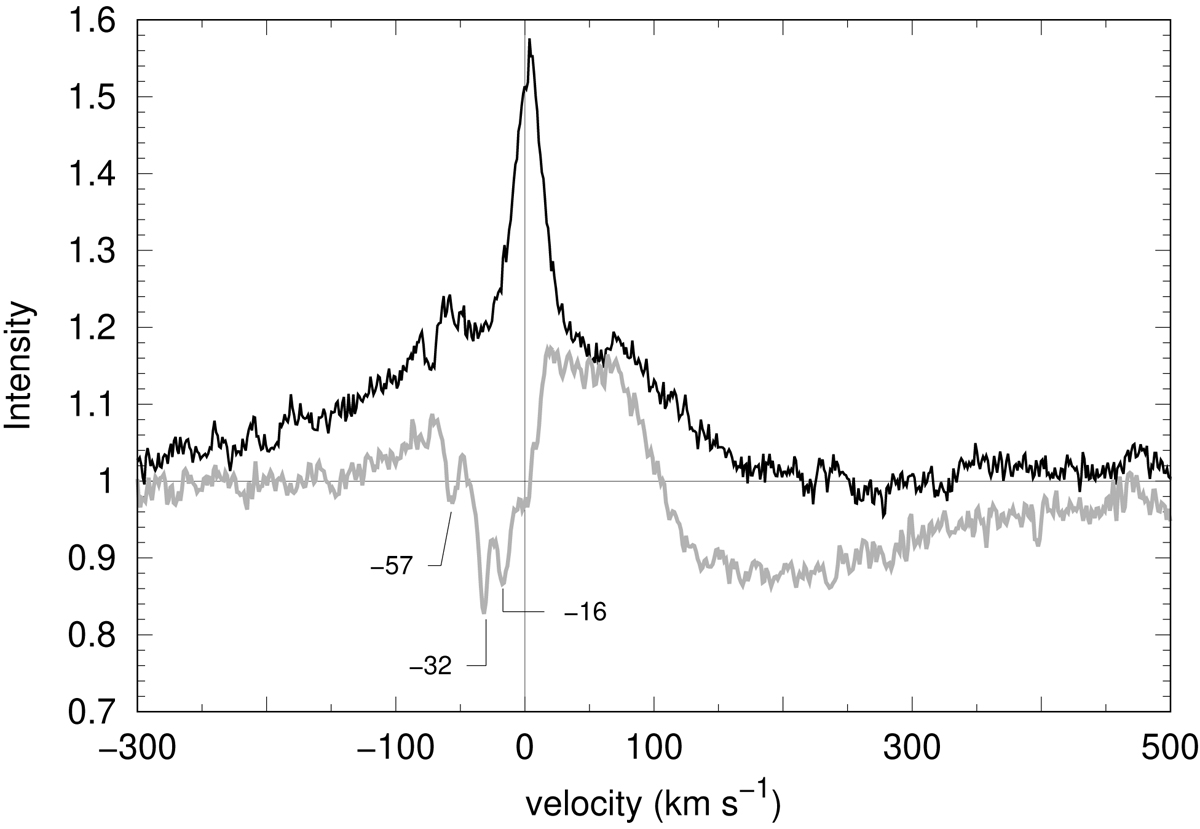
Ca II 8542 Å residual profiles in RZ Psc spectra. The observation on 2013 October 21 is shown by the black line, and the 2013 November 16 spectrum is plotted in light gray. The velocities of the BACs in km s−1 are labeled on the plots.
Current usage metrics show cumulative count of Article Views (full-text article views including HTML views, PDF and ePub downloads, according to the available data) and Abstracts Views on Vision4Press platform.
Data correspond to usage on the plateform after 2015. The current usage metrics is available 48-96 hours after online publication and is updated daily on week days.
Initial download of the metrics may take a while.