Fig. 2.
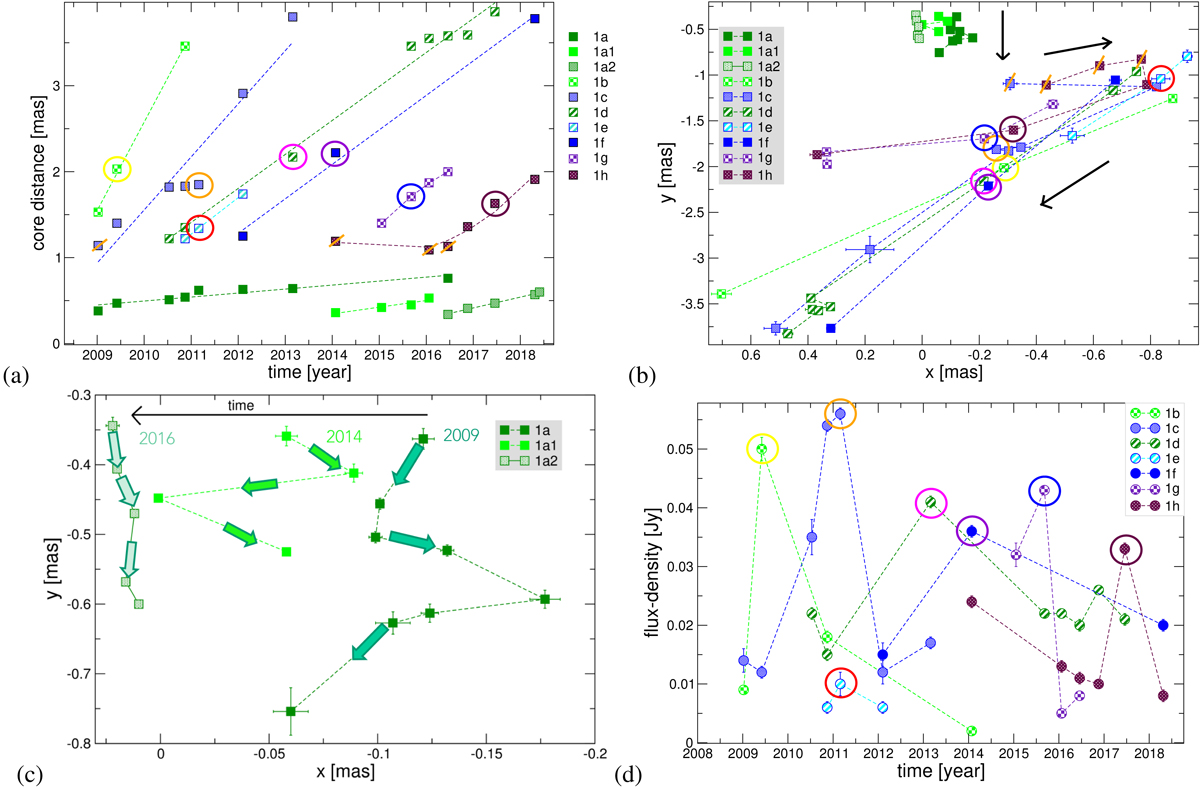
Panel a: core distances of the jet features that could be traced through the epochs in the one-jet scenario. The proper motions were determined via linear regression (dashed lines), for feature 1h a quadratic fit is shown. For jet components 1c and 1h some components are crossed by an orange line; these lines mark those epochs where the component motion seems to be along a curve. The colored rings refer to the component’s maximum flux-density (see panel d). Panel b: component paths in x and y for those features shown in panel a. Again, the orange lines mark the epochs where motion along a curve (or strongly bent structure) seems to be observed. The black arrows indicate the direction of motion in the case of the one-jet scenario. Panel c: paths of the three innermost components that could be traced in panels a and b. Panel d: flux-density evolution of the jet components 1b–1h as a function of time. The colored circles indicate the times of their maxima. The same circles and colors are used in panels a and b.
Current usage metrics show cumulative count of Article Views (full-text article views including HTML views, PDF and ePub downloads, according to the available data) and Abstracts Views on Vision4Press platform.
Data correspond to usage on the plateform after 2015. The current usage metrics is available 48-96 hours after online publication and is updated daily on week days.
Initial download of the metrics may take a while.