Fig. 3.
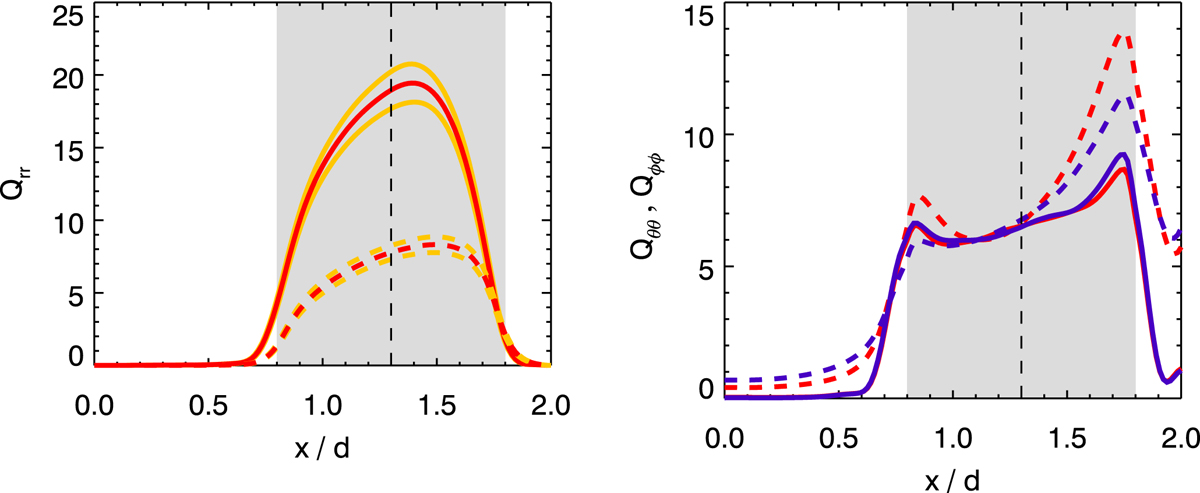
Convection of slow rotation (Ω = 1, solid lines) and fast rotation (Ω = 30, dashed lines). Left: Qrr, right: Qθθ (red lines) and Qϕϕ (blue lines). The gray-shaded area indicates the convectively unstable part with the vertical dashed line showing its center and d is the thickness of the convectively unstable layer. Correlations Qrr, Qθθ, and Qϕϕ and rotation rates Ω are given in code units. The volume-averaged turbulence intensity is ![]() and the co-latitude θ = 45°.
and the co-latitude θ = 45°.
Current usage metrics show cumulative count of Article Views (full-text article views including HTML views, PDF and ePub downloads, according to the available data) and Abstracts Views on Vision4Press platform.
Data correspond to usage on the plateform after 2015. The current usage metrics is available 48-96 hours after online publication and is updated daily on week days.
Initial download of the metrics may take a while.