Fig. 9.
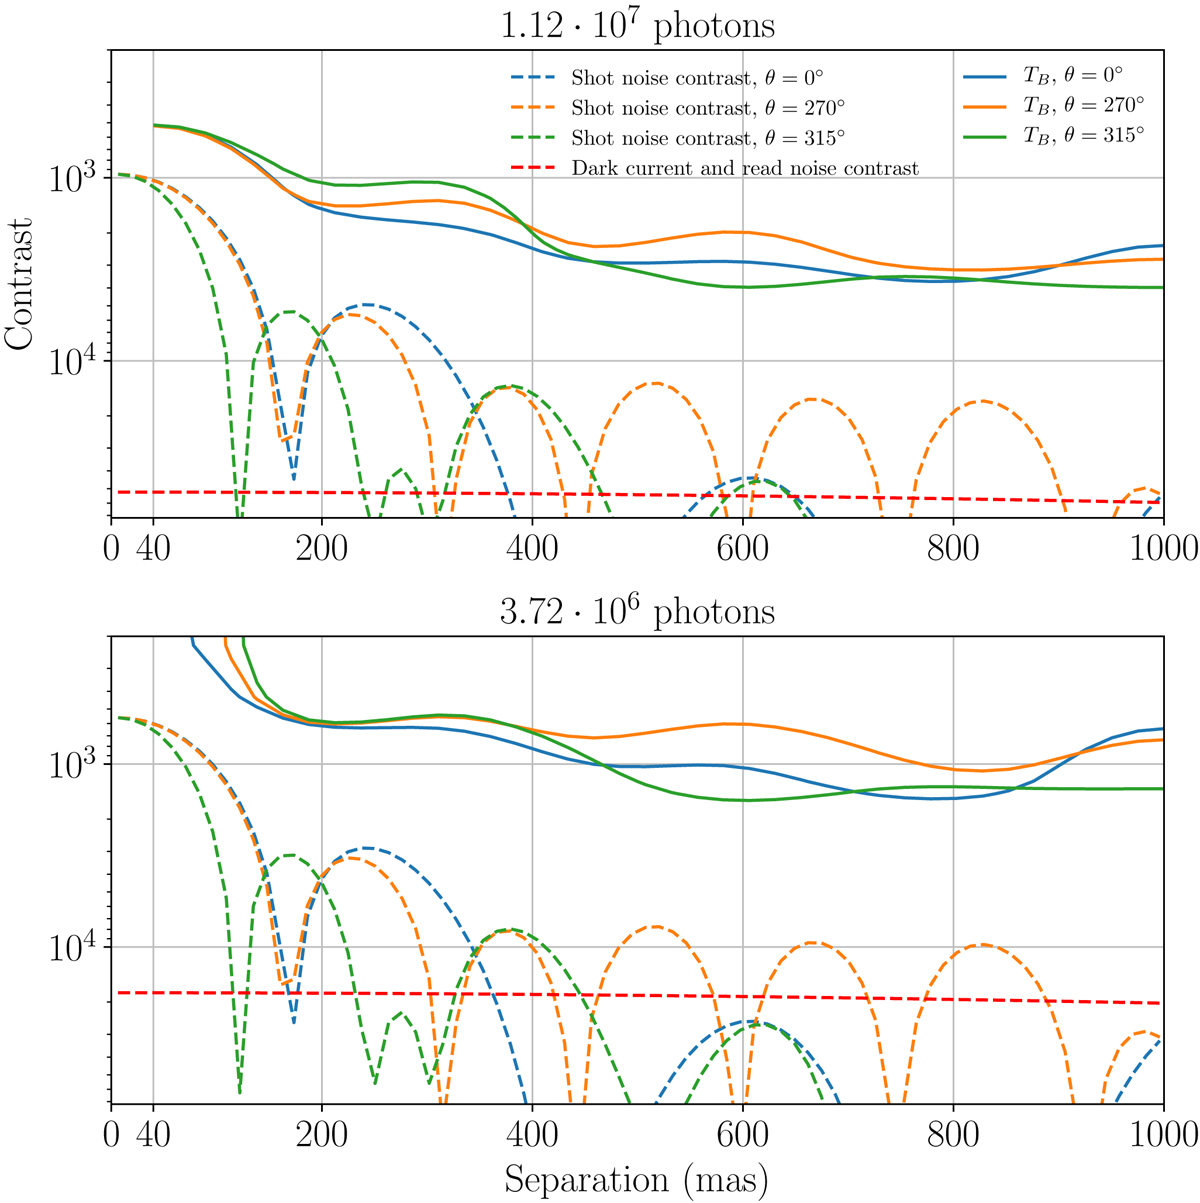
Detection limits for test TB (Eq. (31)), in the higher flux regime (top panel) and the lower flux regime (bottom panel). The solid lines correspond to contours of PDET = 68% at a fixed PFA = 1%. Detection limits are represented at three different position angles for the companion: 0, 45, and 90° off the vertical, as orientated in the PSF shown in Fig. 1. The relative S/Ns (see text) are indicated by dashed lines. The shot (photon) noise is the main limiting noise in most cases.
Current usage metrics show cumulative count of Article Views (full-text article views including HTML views, PDF and ePub downloads, according to the available data) and Abstracts Views on Vision4Press platform.
Data correspond to usage on the plateform after 2015. The current usage metrics is available 48-96 hours after online publication and is updated daily on week days.
Initial download of the metrics may take a while.