Fig. 8.
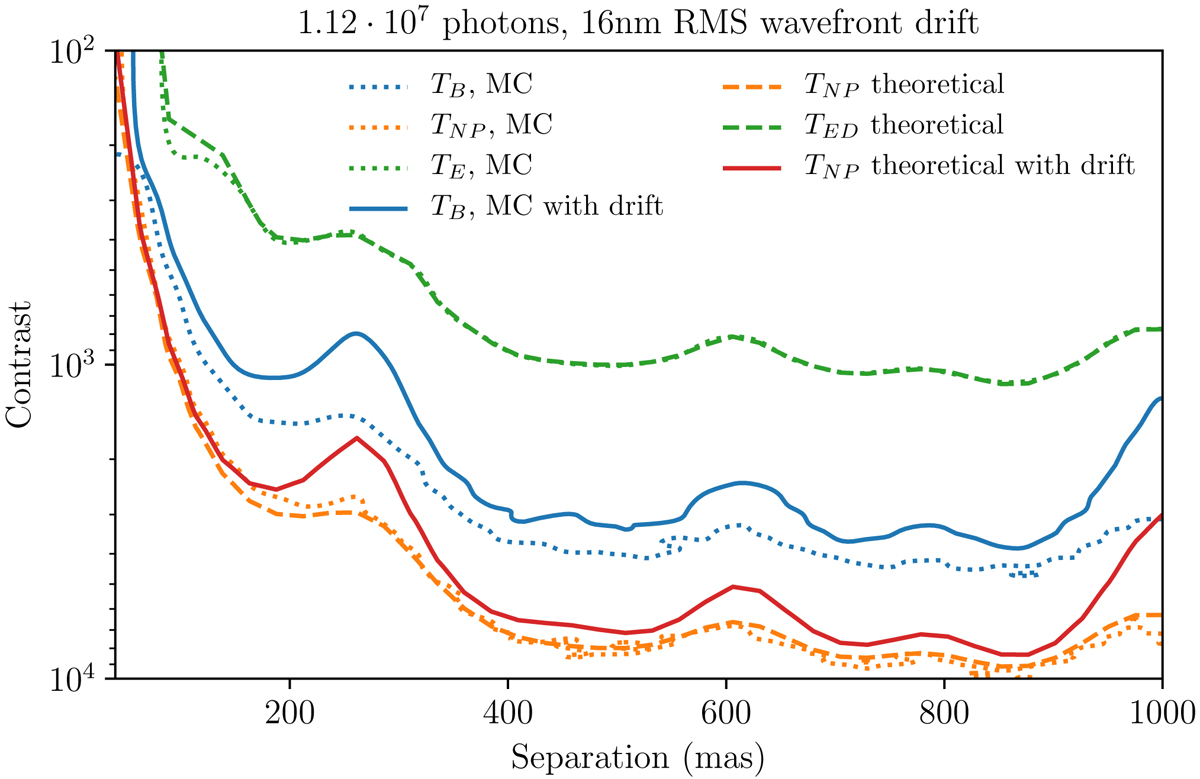
Detection limits at a fixed position angle θ = 315°: below the contours the PDET falls below 68% for a fixed PFA of 1%, represented as a function of the separation and contrast of the companions, for TE (green), TB (blue), and TNP (orange). The dashed lines represent theoretical detection limits for TE and TNP (Eqs. (17) and (24)) and the dotted lines present the limits achieved in the MC simulations. TNP (orange) provides ideal detection limits for a Kernel treatment of a JWST-NIRISS image and the practical test TB (dotted blue) has contrast detection limits within a factor of 2.5 of the theoretical maximum. The solid lines represent the detection limits for TB (blue) and TNP (red) with a calibration residual corresponding to a 16 nm rms wavefront drift.
Current usage metrics show cumulative count of Article Views (full-text article views including HTML views, PDF and ePub downloads, according to the available data) and Abstracts Views on Vision4Press platform.
Data correspond to usage on the plateform after 2015. The current usage metrics is available 48-96 hours after online publication and is updated daily on week days.
Initial download of the metrics may take a while.