Fig. 7.
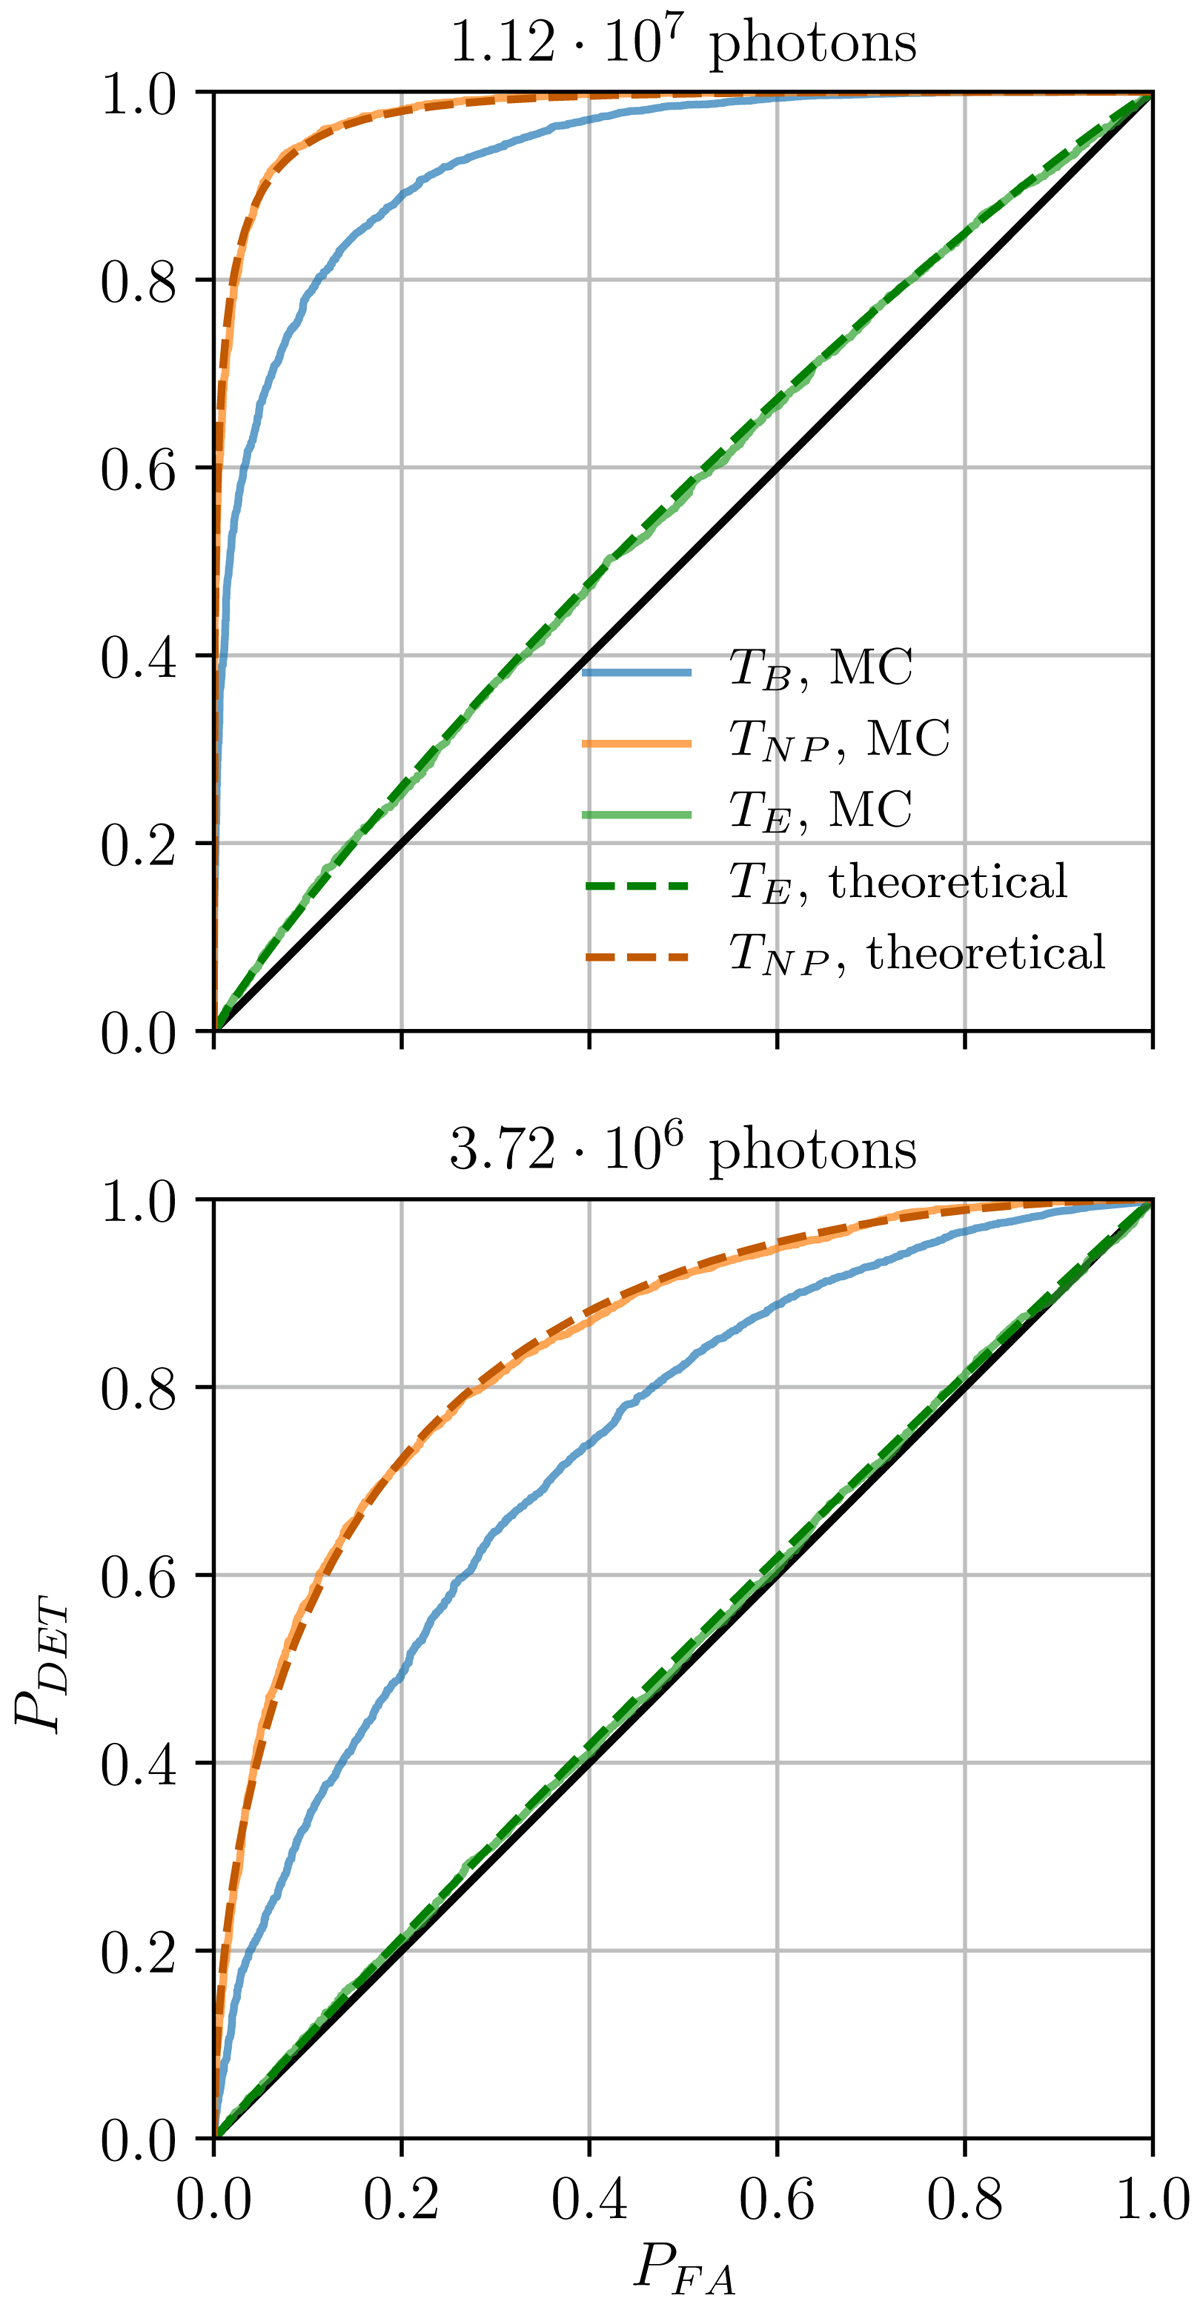
ROC curves of TE (green), TNP (blue), and TB (orange). Theoretical ROC curves for TNP and TE plotted using Eqs. (17) and (24), for a companion at ρ = 200 mas, c = 1200, and θ = 45° off the vertical. Dashed lines correspond to theoretical ROCs, while solid lines represent ROCs obtained by Monte-Carlo simulations. The closer a curve is to the black line on the diagonal, the less powerful the corresponding test. The higher flux regime is represented in the top panel, and the lower flux regime in the bottom panel. The performance of TNP and TE are accurately described by the theoretical expressions in Eqs. (17) and (24). The test TNP presents the highest performance. TB is the next-best-performing test and TE has the lowest performance of the three. We see a clear improvement of the power of all tests as the flux (and thus the S/N) increases.
Current usage metrics show cumulative count of Article Views (full-text article views including HTML views, PDF and ePub downloads, according to the available data) and Abstracts Views on Vision4Press platform.
Data correspond to usage on the plateform after 2015. The current usage metrics is available 48-96 hours after online publication and is updated daily on week days.
Initial download of the metrics may take a while.