Fig. 3.
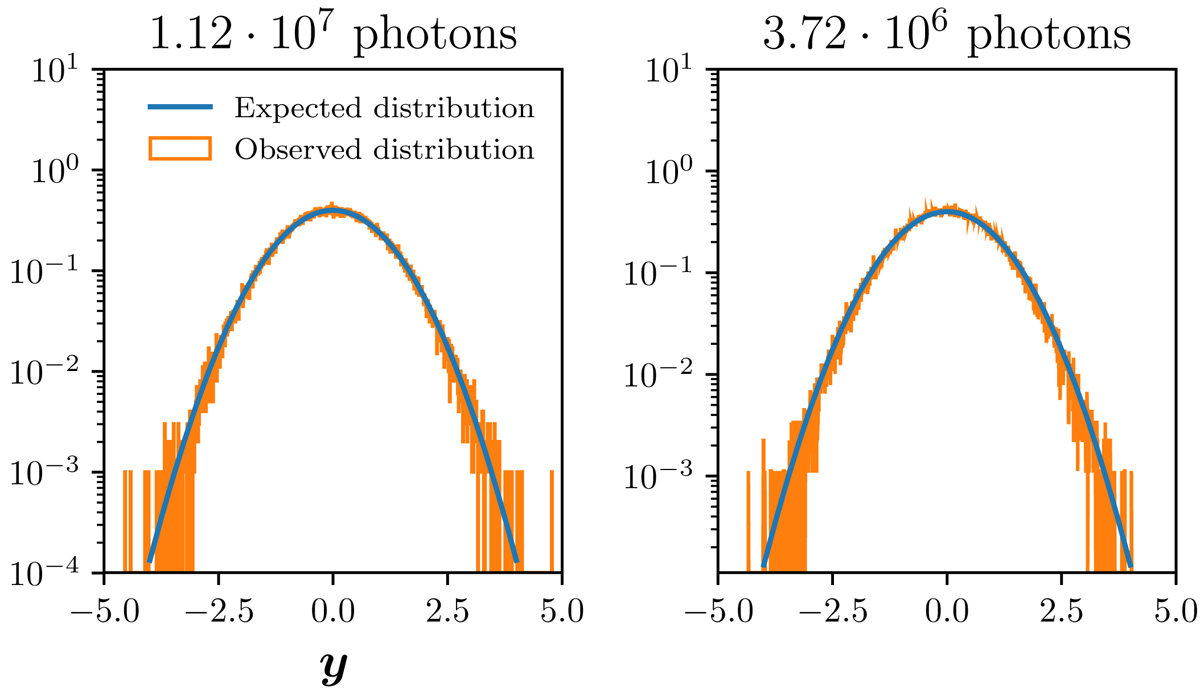
Histogram of the values of the whitened kernel phases for the calibration images (orange). Standard, normal distribution (blue). Left-panel: higher flux regime. Right panel: lower flux regime. The distribution of whitened kernel phases obtained in practice is accurately described by the theoretical normal distribution considered in Eq. (10).
Current usage metrics show cumulative count of Article Views (full-text article views including HTML views, PDF and ePub downloads, according to the available data) and Abstracts Views on Vision4Press platform.
Data correspond to usage on the plateform after 2015. The current usage metrics is available 48-96 hours after online publication and is updated daily on week days.
Initial download of the metrics may take a while.