Fig. 3.
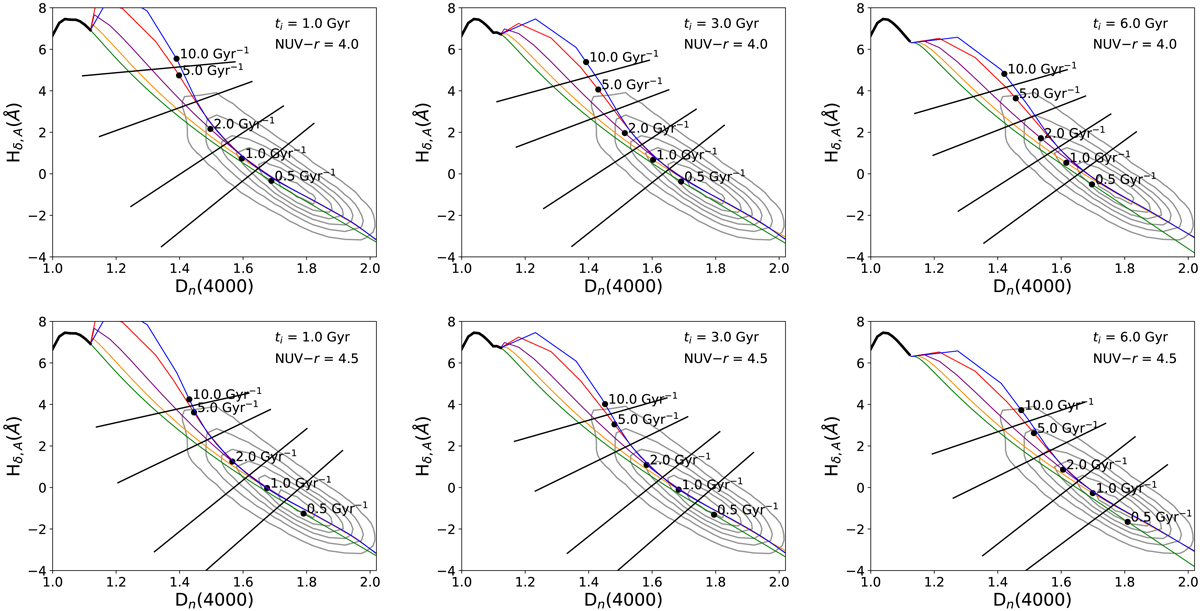
Evolution of Hδ, A × Dn(4000) planes, considering five γ values from the SFH model described in Eqs. (5) and (6) (0.5 Gyr−1, 1 Gyr−1, 2 Gyr−1, 5 Gyr−1, and 10 Gyr−1). The black dots represent the spectral indices on the planes for a specific SFH and NUV −r colour. Different NUV −r colours show different spectral indices for the same SFH. The grey contours are the distribution of the spectral indices of green valley galaxies measured from SDSS spectra. The straight lines are a geometric average of the spectroscopic indices of two consecutive black dots, dividing the plane into parts and allowing us to computationally interpolate it. For different values of ti the position of the black dots does not change considerably, demonstrating that our model is weakly dependent on the ti parameter.
Current usage metrics show cumulative count of Article Views (full-text article views including HTML views, PDF and ePub downloads, according to the available data) and Abstracts Views on Vision4Press platform.
Data correspond to usage on the plateform after 2015. The current usage metrics is available 48-96 hours after online publication and is updated daily on week days.
Initial download of the metrics may take a while.