Free Access
Fig. 11.
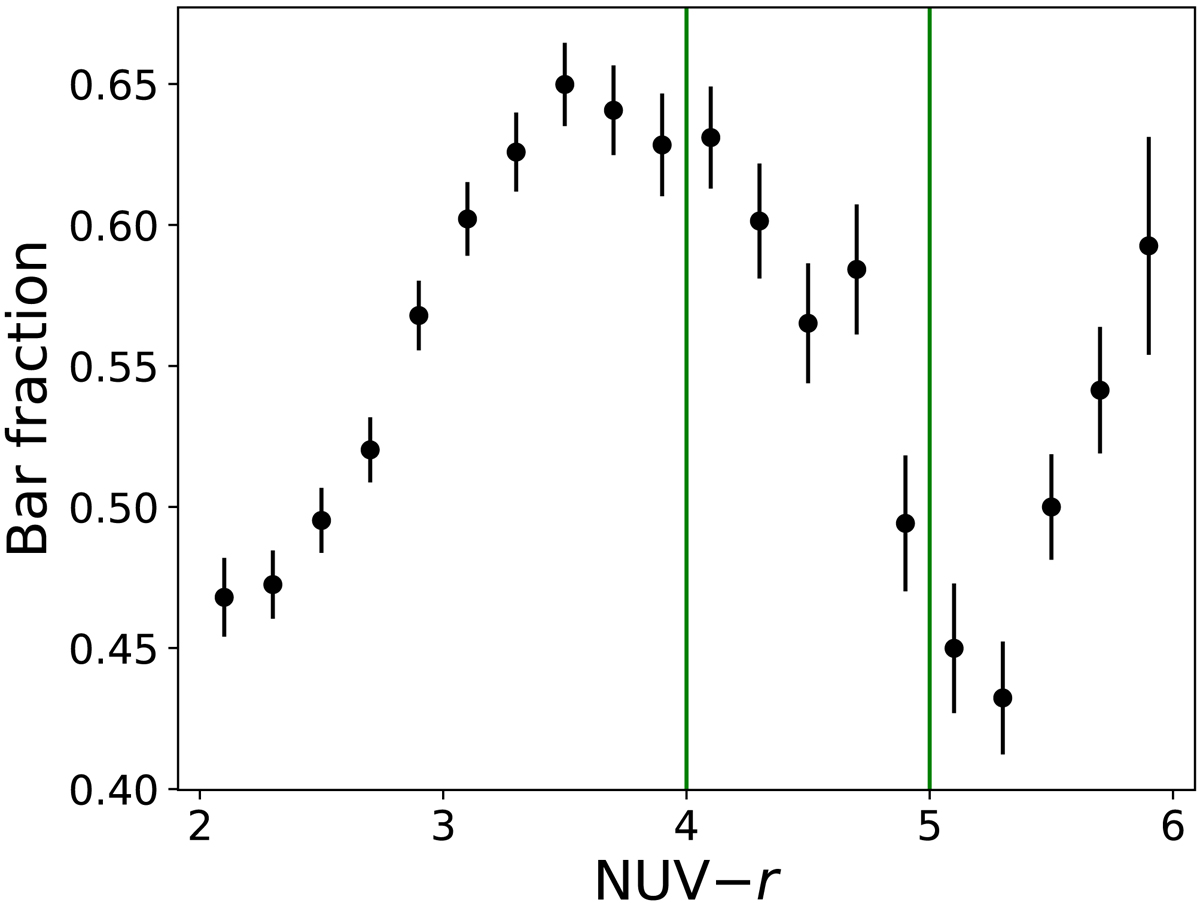
Bar fraction as a function of dust-corrected NUV −r colour. We estimate the error bars as ![]() (e.g. Sheth et al. 2008), where f is the bar fraction and N is the total number of galaxies in each colour bin. The green vertical lines delimit the green valley region.
(e.g. Sheth et al. 2008), where f is the bar fraction and N is the total number of galaxies in each colour bin. The green vertical lines delimit the green valley region.
Current usage metrics show cumulative count of Article Views (full-text article views including HTML views, PDF and ePub downloads, according to the available data) and Abstracts Views on Vision4Press platform.
Data correspond to usage on the plateform after 2015. The current usage metrics is available 48-96 hours after online publication and is updated daily on week days.
Initial download of the metrics may take a while.