Fig. 1.
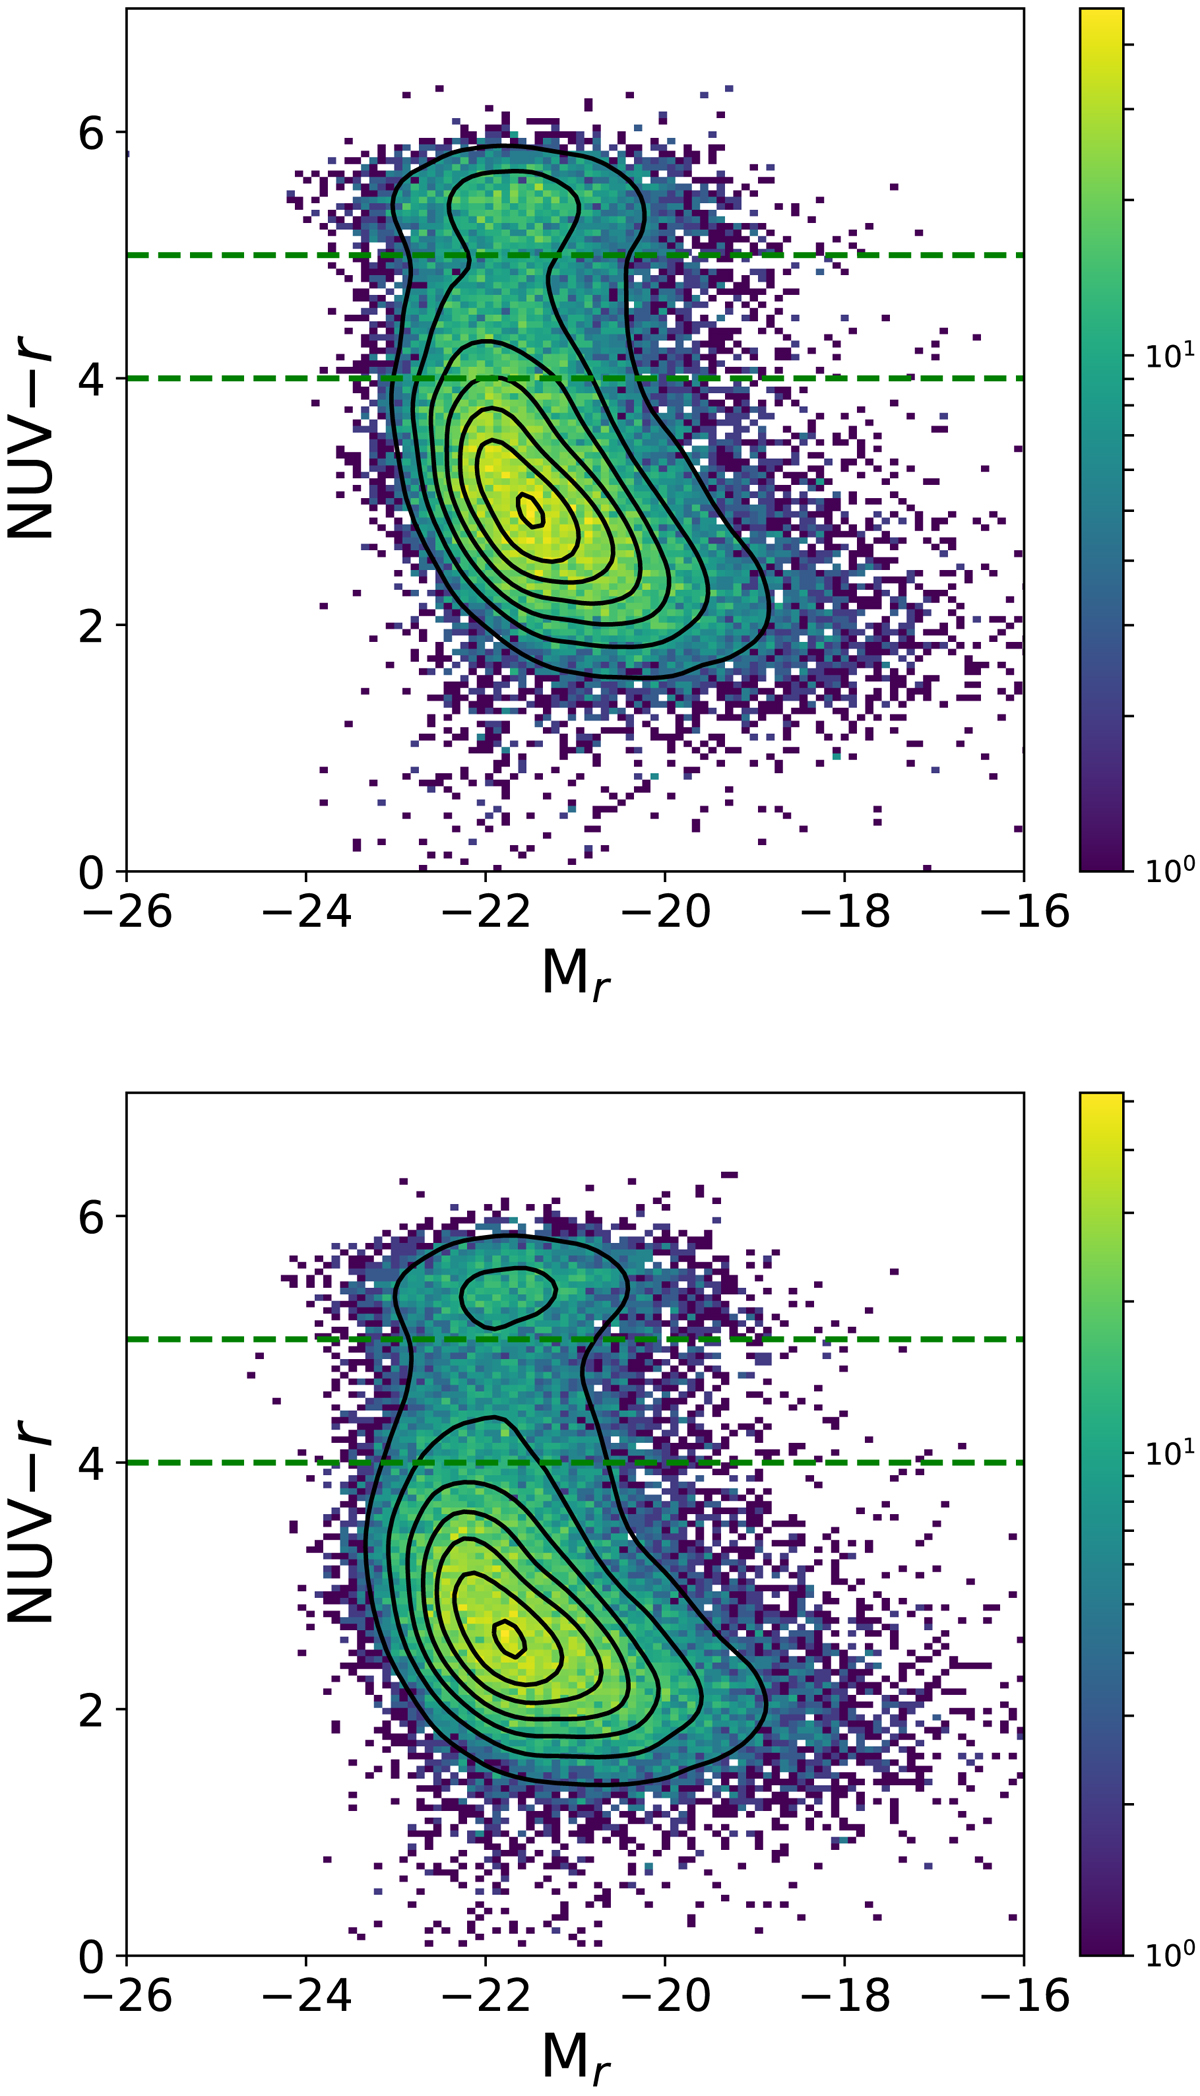
Colour–magnitude diagrams of SDSS+GALEX galaxies at z < 0.2, uncorrected (top panel) and corrected (bottom panel) by intrinsic extinction caused by dust. The horizontal dashed lines represent the green valley region. Each contour line represents approximately the same number of galaxies. The colours in the vertical bar on both panels identify the number of galaxies for each bin within the diagrams.
Current usage metrics show cumulative count of Article Views (full-text article views including HTML views, PDF and ePub downloads, according to the available data) and Abstracts Views on Vision4Press platform.
Data correspond to usage on the plateform after 2015. The current usage metrics is available 48-96 hours after online publication and is updated daily on week days.
Initial download of the metrics may take a while.